Heavyweight Report! India’s August Import Data Unveiled, A Must-Read for Trade Enterprises

Publishing Date:2024-09-24 12:18:41 Source: NBD Data(en.nbd.ltd)

In the midst of an ever-changing global economic landscape, India's import-export trade dynamics have garnered significant attention. As a representative of emerging economies, India's monthly customs import data provides crucial market signals for global trade enterprises. The August 2024 Indian customs import data is particularly important, especially given the disruptions in global supply chains. India's procurement trends and market demand have become focal points of attention. This article provides a comprehensive analysis of India's import data for August 2024, revealing the products most favored by Indian buyers and the implications of these trends for import-export businesses. Whether you are a foreign trade company, a SOHO professional, or a market analysis expert, this article will provide forward-looking insights to help you better capture market opportunities.

Overview of India's August Import Data

According to India's customs import data for August 2024, the country recorded 5,019,114 import entries, representing a decrease of 393,117 entries compared to the previous month, a month-over-month (MoM) decline of 7.26%. However, when compared to the same period last year, with 4,383,435 entries, this marks an increase of 635,679 entries, a year-over-year (YoY) rise of 14.50%. Despite the monthly decline, this shows a significant improvement in overall import activity compared to last year, indicating steady growth in India's market demand.

In terms of monetary value, India’s total imports in August 2024 reached $68,040,457,047, reflecting a 14.87% decline from the previous month's total of $79,923,423,894, a reduction of $11,882,966,847. However, compared to August 2023’s $53,303,800,292, the total import value increased by 27.65%. This notable rise suggests a strong recovery in India’s market demand, particularly in the sectors of bulk commodities and manufacturing raw materials.

The number of import buyers in August 2024 was 59,269, a 2.33% decrease from last month, with a drop of 1,415 buyers. However, compared to the same period last year, the number of buyers increased by 2,374, marking a 4.17% YoY rise. This indicates that, despite short-term fluctuations, the overall demand for imported goods in the Indian market is steadily increasing.

On the supplier side, a total of 111,888 suppliers were involved in India’s import and export activities this month, a 3.13% decrease from the previous month, with a reduction of 3,609 suppliers. Nevertheless, YoY data shows an increase of 8,659 suppliers, an 8.39% growth. This trend suggests that while certain suppliers have temporarily reduced exports to India, the overall supply chain is still expanding, and India’s appeal to global suppliers remains strong.

This overview provides the macroeconomic background for the article. We will now delve into the specific products and market trends in India's imports this month.


Top 5 Imported Goods in India for August

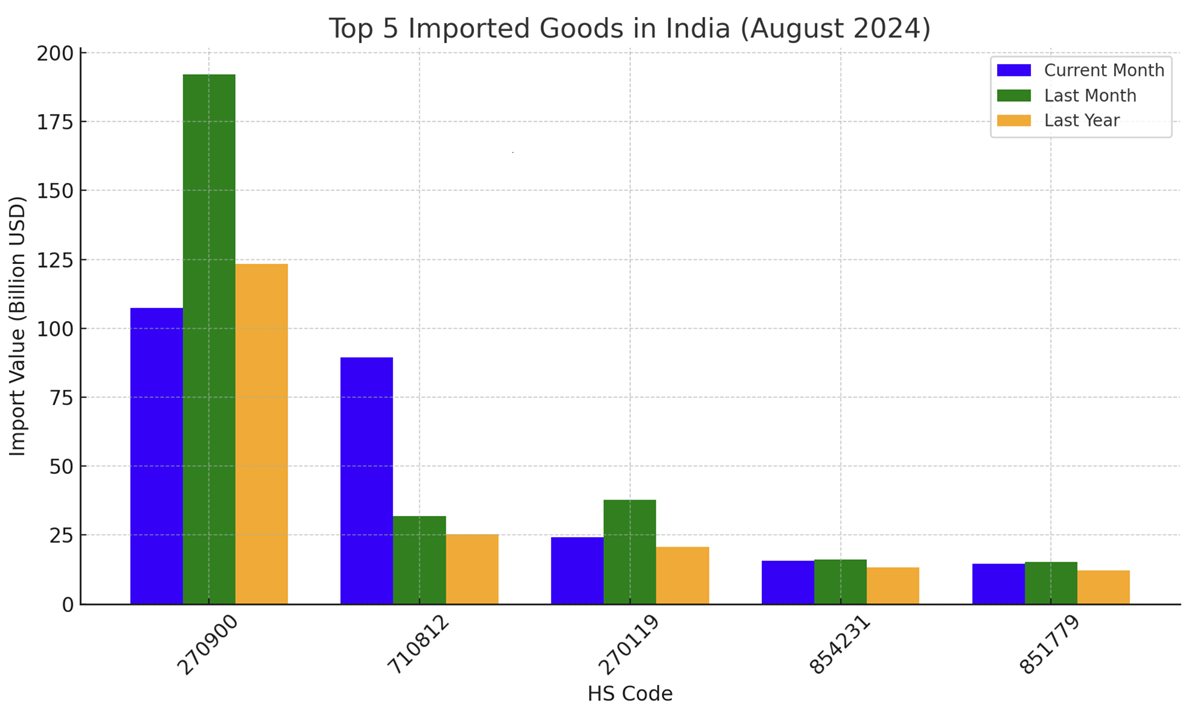
According to India’s customs import data for August 2024, the top five imported goods covered a range of sectors including energy, precious metals, and electronics. Here’s a breakdown of the top categories:

HS Code 270900 - Crude Oil & Unprocessed Petroleum
This month’s import value reached $10.745 billion, representing a 44.10% decrease from last month’s $19.221 billion and a 12.98% year-over-year (YoY) decline. The fluctuation in international oil prices and adjustments in India’s domestic demand are the primary reasons for this drop.

HS Code 710812 - Non-Industrial Diamonds (Uncut or Simply Cut)
Imports amounted to $8.949 billion this month, a massive 181.01% increase from the previous month and a 253.27% YoY surge. The sharp rise in imports is largely driven by a booming demand in the jewelry industry.

HS Code 270119 - Coal (Unprocessed)
This month saw coal imports valued at $2.43 billion, a 35.57% decline from last month, but a 17.61% YoY increase. India’s reliance on coal as a primary energy source remains strong, despite short-term fluctuations in imports.

HS Code 854231 - Semiconductor Devices
The import value for semiconductors was $1.57 billion this month, reflecting a slight 2.18% month-over-month (MoM) decrease, but a 19.29% YoY growth. The continuous demand for semiconductors underscores their importance in India’s expanding electronics industry.

HS Code 851779 - Communication Equipment
Imports in this category reached $1.457 billion, a 4.92% MoM decrease, but an 18.87% YoY increase. The ongoing development of 5G networks has sustained high demand for communication equipment.

Key Buyers for India’s Major Imported Goods

Based on India’s customs import data for August 2024, below are the top product categories and their major buyers. The purchasing amount, as well as month-over-month (MoM) and year-over-year (YoY) changes for each buyer, highlight their importance in the Indian market.


HS Code 270900 - Crude Oil & Unprocessed Petroleum

  • HINDUSTAN PETROLEUM CORPORATION LIMITED (hindustanpetroleum.com)
    August Purchase Amount: $2.264 billion | MoM: $2.620 billion | MoM Decrease: -$356 million | YoY: $2.488 billion | YoY Decrease: -$223 million
  • INDIAN OIL CORPORATION LIMITED (iocl.com)
    August Purchase Amount: $1.802 billion | MoM: $3.125 billion | MoM Decrease: -$1.323 billion | YoY: $3.015 billion | YoY Decrease: -$1.213 billion
  • BHARAT PETROLEUM CORPORATION LIMITED (bharatpetroleum.in)
    August Purchase Amount: $1.775 billion | MoM: $2.520 billion | MoM Decrease: -$745 million | YoY: $2.073 billion | YoY Decrease: -$297 million

HS Code 710812 - Non-Industrial Diamonds (Uncut or Simply Cut)

  • MMTC - PAMP INDIA PRIVATE LIMITED (mmtcpamp.com)
    August Purchase Amount: $2.103 billion | MoM: $1.171 billion | MoM Increase: +$931 million | YoY: $716 million | YoY Increase: +$1.387 billion
  • HDFC BANK LIMITED (hdfcbank.com)
    August Purchase Amount: $1.803 billion | MoM: $264 million | MoM Increase: +$1.539 billion | YoY: $248 million | YoY Increase: +$1.555 billion
  • ICICI BANK LTD. (icicibank.com)
    August Purchase Amount: $1.229 billion | MoM: $365 million | MoM Increase: +$864 million | YoY: $158 million | YoY Increase: +$1.071 billion

HS Code 270119 - Coal (Unprocessed)

  • TATA STEEL LIMITED (tatasteel.com)
    August Purchase Amount: $344 million | MoM: $582 million | MoM Decrease: -$238 million | YoY: $150 million | YoY Increase: +$194 million
  • JSW STEEL LIMITED (jsw.in)
    August Purchase Amount: $332 million | MoM: $206 million | MoM Increase: +$125 million | YoY: $281 million | YoY Increase: +$50 million
  • STEEL AUTHORITY OF INDIA LIMITED (sail.co.in)
    August Purchase Amount: $306 million | MoM: $613 million | MoM Decrease: -$307 million | YoY: $373 million | YoY Decrease: -$67 million

HS Code 854231 - Semiconductor Devices

  • FOXCONN HON HAI TECHNOLOGY INDIA MEGA DEVELOPMENT (foxconn.com)
    August Purchase Amount: $336 million | MoM: $342 million | MoM Decrease: -$6 million | YoY: $413 million | YoY Decrease: -$77 million
  • DBG TECHNOLOGY INDIA PRIVATE LIMITED (dbgindia.in)
    August Purchase Amount: $123 million | MoM: $128 million | MoM Decrease: -$5 million | YoY: $122 million | YoY Increase: +$1 million

HS Code 851779 - Communication Equipment

  • FOXCONN HON HAI TECHNOLOGY INDIA MEGA DEVELOPMENT (foxconn.com)
    August Purchase Amount: $542 million | MoM: $638 million | MoM Decrease: -$96 million | YoY: $667 million | YoY Decrease: -$125 million
  • PEGATRON TECHNOLOGY INDIA PRIVATE LIMITED (pegatroncorp.com)
    August Purchase Amount: $102 million | MoM: $65 million | MoM Increase: +$37 million | YoY: $84 million | YoY Increase: +$19 million


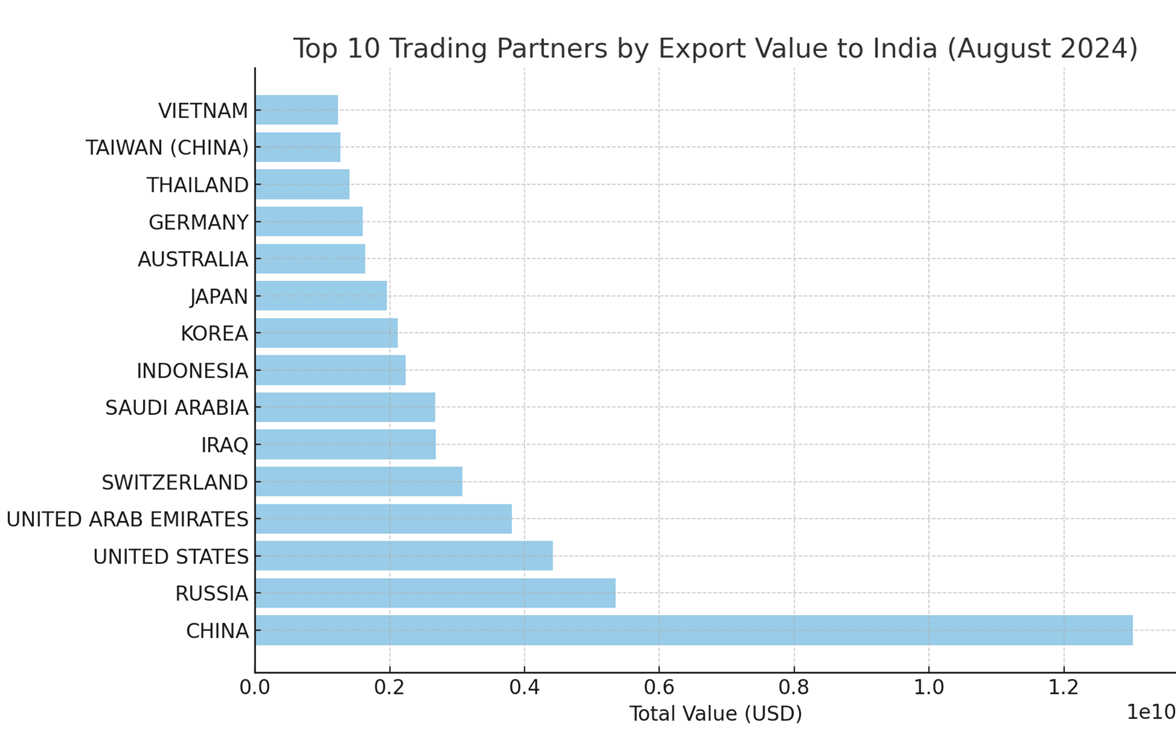
The chart illustrates the export value of India's top 10 trading partners for August 2024. China leads with an export value of over $13 billion, followed by Russia and the United States. The chart, based on total export value, clearly reflects the contribution of each major trading partner to India's imports.

Analysis:

  • China is India’s largest trading partner, with a total of 2,060,523 import entries and 50,097 exporters in August. Despite a month-over-month decrease in total entries (-91,337), the year-over-year increase is significant, with entries up by 386,894 and a total value increase of $2.652 billion. This indicates India’s growing dependence on Chinese goods, particularly in communication equipment and electronic components.

  • Russia is India’s primary supplier of energy products. Although it has fewer export entries compared to other partners, the total export value reached $5.349 billion. However, the export value saw a sharp month-over-month decline (-$5.148 billion), likely due to energy price fluctuations.

  • The United States ranks as India’s third-largest trading partner, with a total export value of $4.42 billion. The year-over-year value grew by $881 million, primarily driven by increased demand for technology products and medical equipment.

  • The United Arab Emirates (UAE), which primarily exports oil and gold, saw a total export value of $3.808 billion. The year-over-year increase of $1.014 billion reflects sustained demand in the energy and jewelry sectors.

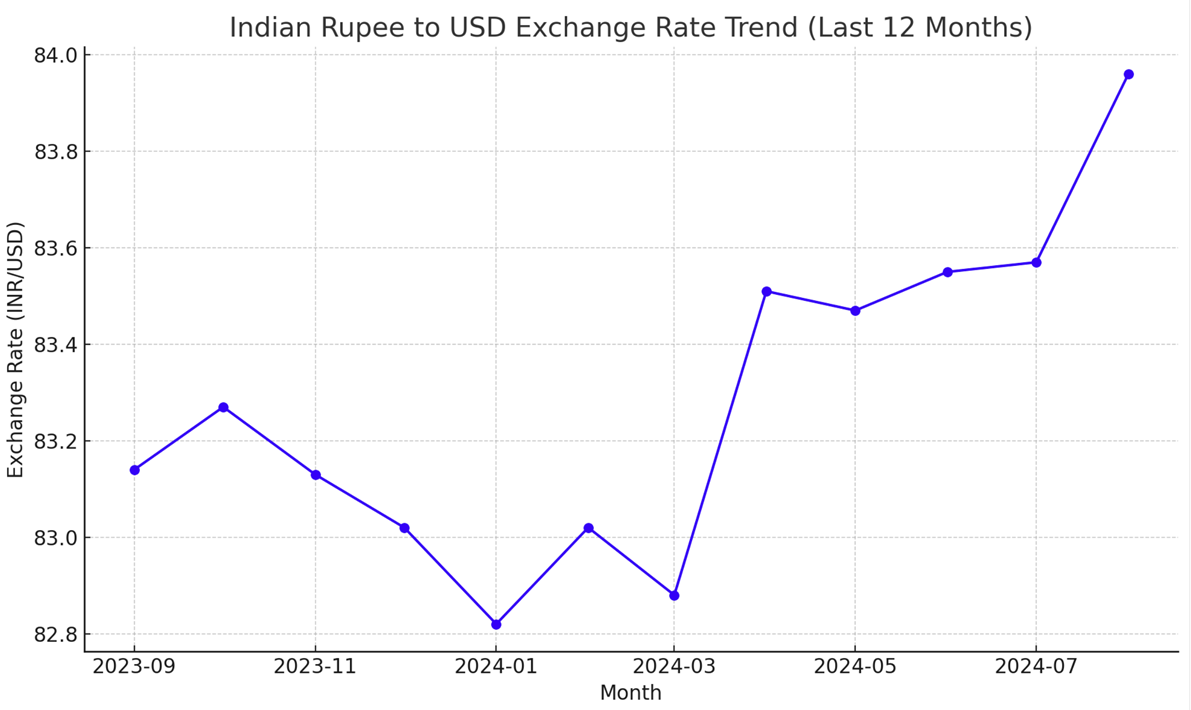
The chart illustrates the exchange rate trend of the Indian Rupee (INR) against the US Dollar (USD) over the past 12 months. The data shows that there was some fluctuation in early 2024, and particularly after April 2024, the Indian Rupee began to depreciate, with the exchange rate rising to 83.96.

Analysis:

  • From September 2023 to March 2024, the INR/USD exchange rate remained relatively stable with minor fluctuations. This stability is likely tied to a relatively calm global market and steady domestic economic conditions in India.

  • After April 2024, the exchange rate saw a sharp increase, indicating a depreciation of the Indian Rupee. The exchange rate climbed from 83.02 to 83.96. This change is likely influenced by global market volatility, inflation, and international capital flows.

Future Outlook:
The depreciation of the Indian Rupee against the US Dollar is likely to continue, especially given increasing global economic uncertainty. If India is unable to control inflation or attract more foreign investment, the exchange rate may rise even further, signaling continued pressure on the Rupee.

Through a comprehensive analysis of India’s August 2024 customs import data, it is clear that India's demand for imports continues to grow across several key sectors, particularly in energy, communication equipment, and electronic components. China, as India’s largest trading partner, maintains a strong presence in the import market, while other major partners such as the United States, Russia, and the UAE also play crucial roles in India’s import landscape.

From the exchange rate trend, the continued depreciation of the Indian Rupee against the US Dollar is likely to further impact import costs, especially in the context of rising international oil prices and global supply chain disruptions. Over the coming months, India’s import dynamics may be influenced by exchange rate fluctuations, changes in the global economy, and adjustments in domestic demand.

For foreign trade companies, understanding and navigating the trends in India’s import market is essential. By closely monitoring India’s import data, particularly for major commodities and key trade partners, businesses can better strategize, optimize their supply chains, and seize market opportunities. NBD Data will continue to provide you with the latest and most comprehensive customs data to support every step of your global trade decision-making process.

Disclaimer: The data and analysis in this report are derived from NBD Data's statistical results and may contain some errors. Users should verify these data independently. NBD Data is not responsible for any consequences arising from the use of this report's information.

For more detailed data, please visit NBD Data's official website: en.nbd.ltd

Related Recommendations

Offer

Ecuador’s July 2025 Imports Surge 14.05% to $3.19 Billion, Led by U.S. and China Trade

2025-08-11 17:42:09

In July 2025, Ecuador’s import activity experienced a significant upswing, with total imports reaching $3.19 billion, marking a 14.05% increase compared to $2.80 billion in June. This growth was supported by 1,638,334 transaction records, underscoring strong trade activity and the resilience of the country’s import sector amid evolving global market conditions.Six-Month Trend AnalysisOver the past six months, Ecuador’s import value has demonstrated a steady upward trend, peaking in July after a moderate dip in June. February recorded $2.78 billion in imports, followed by a slight decline in March to $2.68 billion. April and May saw renewed momentum at $2.74 billion and $2.89 billion, respectively, before a drop to $2.80 billion in June. July’s rebound to $3.19 billion coincided with a notable contraction in the number of domestic importers, from 113,403 in June to 65,277 in July, suggesting concentration of larger import transactions among fewer but possibly more capital-intensive companies. Transaction volumes mirrored this contraction, dropping from 1.92 million records in June to 1.64 million in July, indicating a possible shift toward high-value goods.Top 10 Trade PartnersThe United States maintained its position as Ecuador’s top import partner in July, supplying goods worth $829 million. This trade involved 50,738 Ecuadorian importers and 2,744 U.S. suppliers, covering 2,369 product categories, with petroleum products, machinery, and electronics being key sectors.China ranked second with $682 million in imports, driven by high volumes of manufactured goods, industrial machinery, and electronics. A total of 5,389 Ecuadorian importers engaged with 6,020 Chinese suppliers, covering 2,639 categories.Panama followed with $253 million in trade, a notable share given its smaller supplier base of 261 companies serving 1,655 Ecuadorian importers. This reflects Panama’s role as a regional logistics hub for petroleum derivatives and re-exports.Colombia ranked fourth with $183 million, involving 1,721 Ecuadorian importers and 1,297 Colombian suppliers, spread across 1,526 categories, with agricultural commodities and construction materials being prominent.The remaining six partners—Peru, Brazil, Spain, Italy, Chile, and Argentina—collectively contributed a diversified import portfolio exceeding $5.0 billion annually, reflecting strong regional and intercontinental ties.Fastest-Growing Trade PartnersCambodia recorded an unprecedented surge to $55,485 from only $6 last month, reflecting a 890,513.16% growth, likely due to a large one-off shipment in textiles or specialty goods.Myanmar saw imports rise to $7,849, a 1,891.83% jump, suggesting the beginning of small-scale trade channels.Bolivia surged to $16.32 million, up 1,450.33%, largely in minerals and food products.Morocco posted $121,231, up 1,084.70%, possibly linked to increased demand for specialized industrial materials.Kuwait expanded its exports to Ecuador to $34,323, up 882.82%, potentially tied to petrochemical products.Commodity Trends and HS Code AnalysisThe fastest-growing commodity in July was HS 270750Aromatic hydrocarbon mixtures, which surged 122.28% to $220.11 million. Key buyers included EMPRESA PUBLICA DE HIDROCARBUROS DEL ECUADOR EP PETROECUADOR($130.02 million), EMPRESA DE HIDROCARBUROS DEL ECUADOR EP PETROECUADOR($89.86 million), and INDUSTRIAL LATINA S.A..HS 870121(Motor vehicles for the transport of persons, diesel-powered) grew 54.53% to $13.87 million, with major importers such as INDUSUR INDUSTRIAL DEL SUR S. A.and COMERCIAL CARLOS ROLDAN CIA. LTDA..HS 842952(Mechanical shovels, excavators, and shovel loaders with 360° rotation) increased 52.62% to $21.04 million, led by IASA S.A.and DITECA S.A.HS 852872(Color television reception apparatus) rose 50.90% to $15.30 million, with leading buyers including INTELLCARD S.A.and CAR SOUNDVISION CIA. LTDA..HS 390210(Polypropylene in primary forms) grew 50.87% to $12.36 million, with PLASTICSACKS CIA LTDA.and OBEN ECUADOR S.A.among the top buyers.Ecuador’s import sector in July 2025 displayed strong performance, underpinned by surging demand for hydrocarbons, machinery, and consumer electronics. The dominance of the U.S. and China reflects sustained global trade connectivity, while the rise of smaller partners such as Cambodia and Bolivia highlights evolving trade diversification. With energy-related imports leading the surge, Ecuador is positioned for continued trade growth, though the concentration among fewer importers suggests a strategic pivot toward large-scale, high-value transactions....

Offer

May 2025 Trade Snapshot: Colombia’s Imports Rise by 5.87%, Led by U.S. and China

2025-08-01 14:24:07

In May 2025, Colombia's total import value reached $6.13 billion, reflecting a 5.87% increase from April’s $5.79 billion. This uptick was supported by an expansion in trade activity, as the country recorded 331,782 import transactions across the month. The surge also coincided with a rise in active importers, underscoring a robust recovery in demand across key industrial sectors.Over the past six months, Colombia’s import volume demonstrated a steady upward trend, particularly after a dip in early 2025. From December 2024’s $5.65 billion, the figure declined slightly in January and February, followed by consecutive growth through March, April, and May. Notably, the number of domestic import companies climbed from 11,709 in February to 13,205 in May, while the total monthly transaction count increased by over 30,000 entries within the same period. This suggests growing commercial engagement and a diversification in sourcing activity.Among Colombia’s top ten import partners in May 2025, the United States maintained its leading position with $1.747 billion in trade value. A total of 4,258 Colombian importers were active in transactions with the U.S., involving 2,745 suppliers and over 5,700 product categories—a testament to the deep and varied commercial ties, particularly in pharmaceuticals, machinery, and electronics.China ranked second with $913 million in imports. Trade was conducted by 5,809 Colombian companies sourcing from 2,785 Chinese exporters, encompassing over 8,300 distinct product categories, the highest among all partners. This highlights China’s role as a broad-spectrum supplier, especially in consumer electronics and industrial goods.Panama stood out with $341 million in trade, facilitated by 774 Colombian firms and 1,658 Panamanian suppliers. As a strategic transshipment and re-export hub, Panama’s importance lies in its logistical advantage and flexibility across diverse commodity types.Switzerland followed closely with $325 million in imports. Although involving a relatively modest 385 Colombian importers, they engaged with 1,136 Swiss exporters in high-value segments such as chemicals, precision instruments, and medical devices.The remaining six partners—Brazil, Mexico, Germany, Korea, Chile, and even Colombia itself (for intra-national re-importation)—collectively contributed a significant volume of diversified imports. Their combined presence underscores the geographic and sectoral variety in Colombia’s external trade ecosystem.The fastest-growing trade relationships in May were led by Moldova, which recorded a 22,017.78% month-on-month surge, reaching $475,859 from just $2,151 in April. While the absolute figure remains modest, this exponential rise may reflect a new trade channel opening, likely involving agricultural or chemical goods.Croatia and Malta also saw dramatic increases—4,977.76% and 2,777.82% respectively—suggesting emerging niche trade flows or first-time large-volume contracts. Meanwhile, Andorra’s 1,689% surge and Morocco’s significant jump to $3.25 million (+714.16%) reinforce the trend of Colombia tapping into less traditional sourcing markets for specific categories.From a product perspective, urea-based nitrogenous fertilizers (HS Code 310210) topped the growth charts, up 156.48% month-on-month to $41 million. Major importers included PRECISAGRO S.A.S., NITROFERT S.A.S, and ARARAS NUTRICION S A S, reflecting heightened demand in Colombia’s agribusiness sector.In the machinery segment (HS Code 847989), imports surged nearly 100%, led by EMGESA S A ESP, THE ELITE FLOWER SAS C I, and ENERLAND 2007 FOTOVOLTAICA SL, pointing to expansion in energy and automation sectors.Television and video display equipment (HS Code 852872) recorded an 87.11% jump, with top importers such as SAMSUNG ELECTRONICS COLOMBIA S.A., ALKOSTO S.A., and LG ELECTRONICS COL LTDA.responding to rising consumer electronics demand.Pharmaceuticals (HS Code 300215) also grew significantly, with leading firms like ASTRAZENECA COLOMBIA S.A.S., MERCK SHARP AND DOHME COLOMBIA S A S, and PRODS ROCHE S Ashowing strong activity.The most valuable category remained light petroleum oils (HS Code 271012), which rose by 41.99% to a massive $325.9 million. Key importers included ECOPETROL S.A., REFINERIA DE CARTAGENA S.A, and FRONTERA ENERGY COL CORP SUC COL, underscoring continued demand from Colombia’s refining and energy sectors.In conclusion, Colombia’s import performance in May 2025 signals strong momentum, especially in high-value sectors such as energy, electronics, machinery, and agrochemicals. The rise in both volume and diversity of trade partners suggests growing resilience and complexity in the country’s trade structure. Moving forward, continued monitoring of emerging partners and product categories will be key to understanding Colombia’s evolving import dynamics....

Offer

Panama’s Import Performance in June 2025: U.S. and China Lead, Congo Surges

2025-07-30 00:24:43

Panama imported goods worth $1.23 billion in June 2025, reflecting a 4.82% decline from May’s total of $1.29 billion. The number of records filed reached 145,966, and 5,400 domestic importers were active during the period. This moderate month-on-month contraction indicates shifting demand patterns and possible seasonality effects across several key sectors.Over the past six months, Panama’s import value has fluctuated between $1.16 billion and $1.29 billion. January 2025 started strong at $1.26 billion, followed by minor volatility through April. May marked the highest value in the half-year window before June’s decline. The number of domestic importers remained stable, peaking in May with 5,452 active companies. Record volumes followed a similar trajectory, aligning closely with total trade activity.The United States remained Panama’s top trading partner in June, contributing $205 million to the import total. This trade involved 1,840 Panamanian importers and 2,929 U.S. suppliers, with goods spanning 2,276 categories. The U.S. continues to serve as Panama’s key source of industrial, technological, and agricultural products.Close behind was China, with $199 million in imports. 1,927 local buyers sourced from 3,179 Chinese exporters, covering 2,025 product types. This reflects China’s strength in consumer goods, electronics, and intermediate inputs.Mexico took third position at $55 million, with a balanced ecosystem of 485 Panamanian importers and 793 Mexican suppliers, indicating strong regional ties and cost-efficient logistics. Costa Rica followed with $41 million, backed by 308 Panamanian companies trading with 393 Costa Rican partners across 400 goods—a testament to Central American intra-regional trade.Colombia, Spain, Japan, Brazil, and Guatemala rounded out the top ten. Collectively, these partners added significant diversity, contributing both high-tech goods and essential commodities. Their combined presence underscores Panama’s multi-sourced procurement strategy.Among the fastest-growing sources of imports, Congo surged an astonishing 29,033.63%, albeit from a low base, reaching $8,524 in June. Luxembourg followed with a 2,016.73% increase, hitting $124,941. Serbia, Moldova, and Zaire all posted triple-digit percentage gains. While these countries contribute marginally in absolute terms, such spikes often signal emerging trade lanes or one-time strategic deliveries.On the product side, the top-performing categories showed impressive growth. Leading the charge was HS 100119 [wheat and meslin (excluding seed)], which surged 92.11% to $9.79 million. Key buyers included HARINAS DEL ISTMO S.A., GOLD MILLS DE PANAMA S A, and HARINERA ORO DEL NORTE.HS 230990 [non-retail dog/cat food] rose 72.13% to $10.46 million, led by EL ROBLE DEL RIO, S.A. and others.HS 854449 [low-voltage electric conductors]gained 51.91%, with major players including VIAKABLE PANAMA, S.A..HS 870333 [diesel vehicles over 2500cc]and HS 230400 [soybean oilcake and residues] grew 23.40% and 22.46%, respectively, reflecting demand in Panama’s transportation and livestock sectors.In conclusion, Panama’s import activity in June 2025 displayed mild contraction in value yet vibrant diversification across suppliers and products. The United States and China continue to dominate the landscape, while explosive growth from smaller economies signals emerging patterns worth monitoring. Agricultural goods, pet nutrition, and electric components drove product-level momentum, pointing to sustained consumption and infrastructure investment. Looking ahead, these dynamics position Panama for adaptive sourcing in a changing global trade environment....