Namibia Import Market New Trends: August 2024 Customs Data Analysis - A Must-Read for Trade Professionals!
Namibia, as a key trade market in southern Africa, has a profound impact on the foreign trade industry with its diverse range of imported goods and market demand. The August 2024 Namibian import data reveals the latest market dynamics, providing valuable insights for trade professionals, logistics companies, and market analysts. This article comprehensively analyzes the trends and shifts in Namibia's import market, helping businesses and individuals seize new opportunities in international trade.
Overview of Namibia's Import Data for August 2024
According to the latest data from Namibia’s customs in August 2024, the total number of import entries reached 196,168, an increase of 8,090 entries from July’s 188,078 entries, reflecting a month-on-month (MoM) growth of 4.30%. Although there was a decrease of 9,104 entries compared to the same period last year, indicating a year-on-year (YoY) decline of 4.43%, the overall market performance remains vibrant.
In terms of total import value, the figure for August 2024 was USD 872,973,703, representing a 5.66% decrease compared to July’s USD 925,379,668. Moreover, compared to the same period last year, when the total import value was USD 993,040,105, there was a YoY decrease of 12.09%, indicating that Namibia's import demand has slowed down amid the backdrop of global economic uncertainty.
The number of importers this month reached 6,706, a MoM increase of 420, representing a growth of 6.68%. Compared to 6,393 importers in the same period last year, this represents a YoY growth of 4.89%, showing an increasing demand for a diverse range of goods in the Namibian market. Furthermore, the number of suppliers this month reached 11,524, a slight decrease of 1.44% compared to last month's 11,693 suppliers, and a YoY decrease of 9.21% from 12,697 suppliers in August last year. This trend indicates that the supply chain structure in the Namibian market is gradually being optimized, with importers preferring to cooperate with more competitive suppliers.
Overall, the Namibian import market in August 2024 exhibited characteristics of “an increase in total entries, a decrease in total value, more importers, and fewer suppliers.” This suggests that although the number and variety of imported goods are increasing, the overall decline in import value indicates a slowdown in demand for high-value goods. In this context, foreign trade companies can consider enhancing product competitiveness and reducing costs to further strengthen cooperation with the Namibian market.
Top 5 Imported Products in Namibia for August 2024
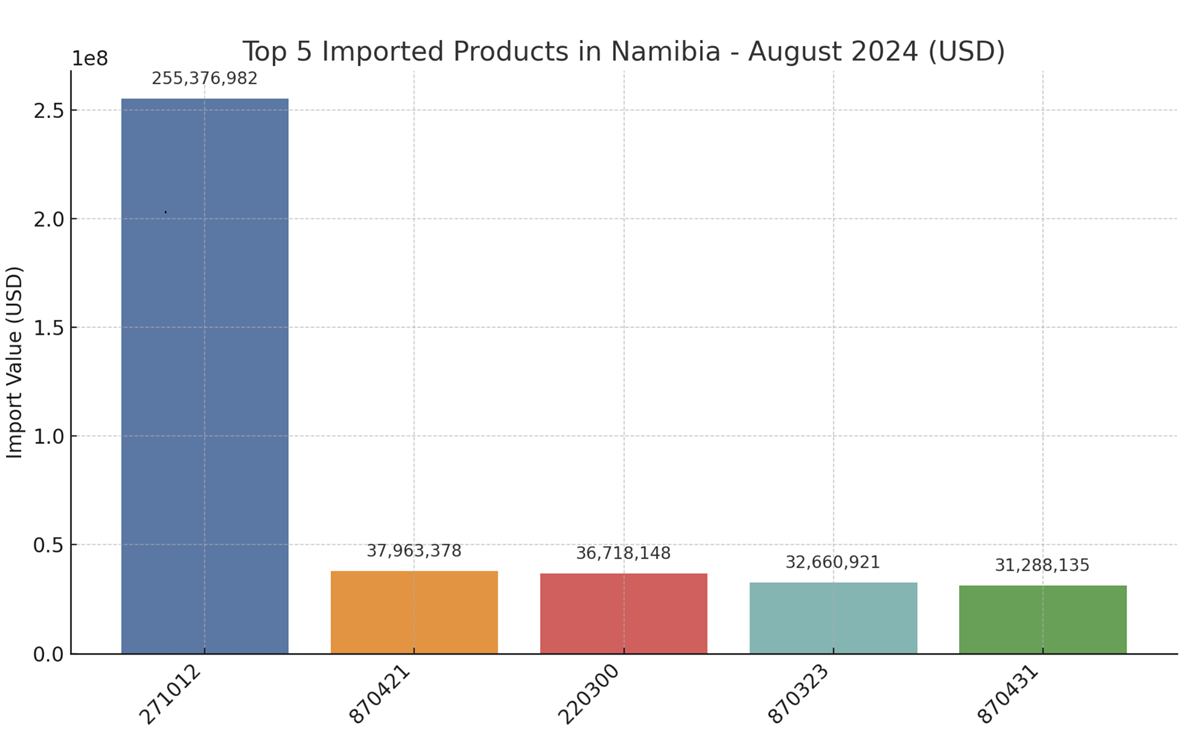
In August 2024, the top five imported product categories in the Namibian market were mainly concentrated in mineral fuels, vehicles and their parts, and food & beverages. The import value of these products accounted for a significant proportion of the overall market and showed varying degrees of fluctuation on both a month-on-month and year-on-year basis.
Mineral Fuels and Products (HS Code: 271012)
The total import value of mineral fuels in Namibia for August was USD 255,376,982, representing a month-on-month decrease of 6.30% compared to July’s USD 272,560,114. When compared to the same period last year (USD 395,383,687), it showed a significant year-on-year decrease of 35.41%. This category primarily includes gasoline, diesel, and other petroleum products, which serve as vital energy sources for Namibia's industrial and transportation sectors. The fluctuation in import value could be closely linked to global energy prices and changes in market demand.
Light Vehicles (HS Code: 870421)
In August 2024, the total import value of light vehicles in Namibia was USD 37,963,378, a substantial month-on-month decline of 35.95% from July’s USD 59,277,714. Compared to the same period last year (USD 44,978,060), there was a year-on-year decline of 15.60%. Light vehicles mainly refer to passenger and cargo vehicles with a weight not exceeding 5 tons. The decrease in import value could be attributed to a decline in local transportation demand and issues related to the global automotive supply chain.
Beer and Malt Beverages (HS Code: 220300)
The total import value of beer and malt beverages for this month was USD 36,718,148, reflecting a 3.33% month-on-month increase from July’s USD 35,536,837. Year-on-year, it showed a remarkable growth of 106.68%, compared to USD 17,764,531 in the same period last year. This increase indicates a growing demand for alcoholic beverages in the Namibian market, likely driven by festive consumption and the revival of the tourism industry.
Medium Passenger Vehicles (HS Code: 870323)
The total import value of medium passenger vehicles (engine capacity between 1500cc and 2500cc) in Namibia for August was USD 32,660,921, representing a 37.59% month-on-month increase from July’s USD 23,738,456 and a 22.42% year-on-year growth. These vehicles are primarily used for public transportation and private use. The increase in import value could be driven by infrastructure development and a rising demand for automobiles in the Namibian market.
Trucks and Specialized Vehicles (HS Code: 870431)
The total import value of trucks and specialized vehicles in Namibia for August 2024 was USD 31,288,135, reflecting a substantial month-on-month increase of 108.52% from July’s USD 15,008,000 and a year-on-year increase of 60.13% from USD 19,542,718 in August last year. These vehicles are primarily used for cargo transportation and engineering purposes. The significant growth in imports reflects a strong demand for logistics and infrastructure development in Namibia.
Overall Analysis
In summary, mineral fuels and vehicles remain the dominant categories in Namibia's import market this month. However, due to fluctuations in the global market and changes in local demand, each product category displayed varying import trends. Trade companies that can keep up with market dynamics and gain deeper insights into local demand shifts will be better positioned to capitalize on potential business opportunities.
Recommended Namibian Buyers for Key Imported Products
Below is a list of recommended buyers for key product categories in the Namibian import market this month, along with the import value and related buyer information. These recommended buyers can provide effective market entry points and potential partnerships for foreign trade companies.
Mineral Fuels and Products (HS Code: 271012)
PUMA ENERGY NAMIBIA TWO PTY LTD. (pumaenergy.com)
Total purchase amount this month: 116,623,495 USD; MoM amount: 104,689,619 USD; MoM change: 11,933,876 USD; YoY amount: 0 USD; YoY change: 116,623,495 USD.VALIDUS ENERGY NAMIBIA PTY LTD. (validus-energy.com)
Total purchase amount this month: 64,379,033 USD; MoM amount: 0 USD; MoM change: 64,379,033 USD; YoY amount: 117,043,855 USD; YoY change: -52,664,822 USD.PUMA ENERGY NAMIBIA PTY LTD. (pumaenergy.com)
Total purchase amount this month: 46,767,233 USD; MoM amount: 57,048,762 USD; MoM change: -10,281,529 USD; YoY amount: 8,014,375 USD; YoY change: 38,752,858 USD.
Light Vehicles (HS Code: 870421)
INDONGO AUTO PTY LTD. (indongomotorsgroup.com)
Total purchase amount this month: 10,709,451 USD; MoM amount: 10,204,779 USD; MoM change: 504,672 USD; YoY amount: 12,123,435 USD; YoY change: -1,413,984 USD.PUPKEWITZ MOTORS PTY LTD. (pupkewitz-motors.com)
Total purchase amount this month: 8,501,153 USD; MoM amount: 7,912,604 USD; MoM change: 588,549 USD; YoY amount: 11,376,313 USD; YoY change: -2,875,160 USD.INDONGO MOTORS PROPRIETARY LTD. (indongomotorsgroup.com)
Total purchase amount this month: 3,178,741 USD; MoM amount: 4,034,807 USD; MoM change: -856,066 USD; YoY amount: 3,958,575 USD; YoY change: -779,834 USD.
Beer and Malt Beverages (HS Code: 220300)
NAMIBIA BREWERIES LTD. (nambrew.com)
Total purchase amount this month: 31,404,027 USD; MoM amount: 30,768,055 USD; MoM change: 635,972 USD; YoY amount: 12,446,598 USD; YoY change: 18,957,429 USD.ANHEUSER-BUSCH INBEV NAMIBIA BREWERIES PTY LTD. (ab-inbev.com)
Total purchase amount this month: 5,076,561 USD; MoM amount: 4,461,444 USD; MoM change: 615,117 USD; YoY amount: 4,895,518 USD; YoY change: 181,043 USD.ZEF COMERCIAL (zefenergy.com)
Total purchase amount this month: 113,805 USD; MoM amount: 43,514 USD; MoM change: 70,291 USD; YoY amount: 44,020 USD; YoY change: 69,785 USD.
Medium Passenger Vehicles (HS Code: 870323)
TRANSWORLD CARGO (PTY) LTD. (transworldcargo.net)
Total purchase amount this month: 13,304,415 USD; MoM amount: 4,394,573 USD; MoM change: 8,909,842 USD; YoY amount: 0 USD; YoY change: 13,304,415 USD.INDONGO AUTO PTY LTD. (indongomotorsgroup.com)
Total purchase amount this month: 2,134,717 USD; MoM amount: 1,486,218 USD; MoM change: 648,499 USD; YoY amount: 3,315,517 USD; YoY change: -1,180,800 USD.FIRST NATIONAL BANK OF NAMIBIA LTD. (fnbnamibia.com.na)
Total purchase amount this month: 1,757,676 USD; MoM amount: 1,278,890 USD; MoM change: 478,786 USD; YoY amount: 1,781,694 USD; YoY change: -24,018 USD.
Diamonds and Jewelry (HS Code: 710231)
- KGK DIAMONDS NAMIBIA PTY LTD. (kgkgroup.com)
Total purchase amount this month: 3,304,952 USD; MoM amount: 695,197 USD; MoM change: 2,609,755 USD; YoY amount: 3,188,010 USD; YoY change: 116,942 USD.
The above buyers are active purchasers of major products in the Namibian market, with high purchase frequency and stable trade demand. Foreign trade companies should prioritize these buyers and use NBD Data (en.nbd.ltd) to further explore potential business opportunities, optimize trade strategies, and enhance market competitiveness.
Analysis of Namibia's Key Trading Partners
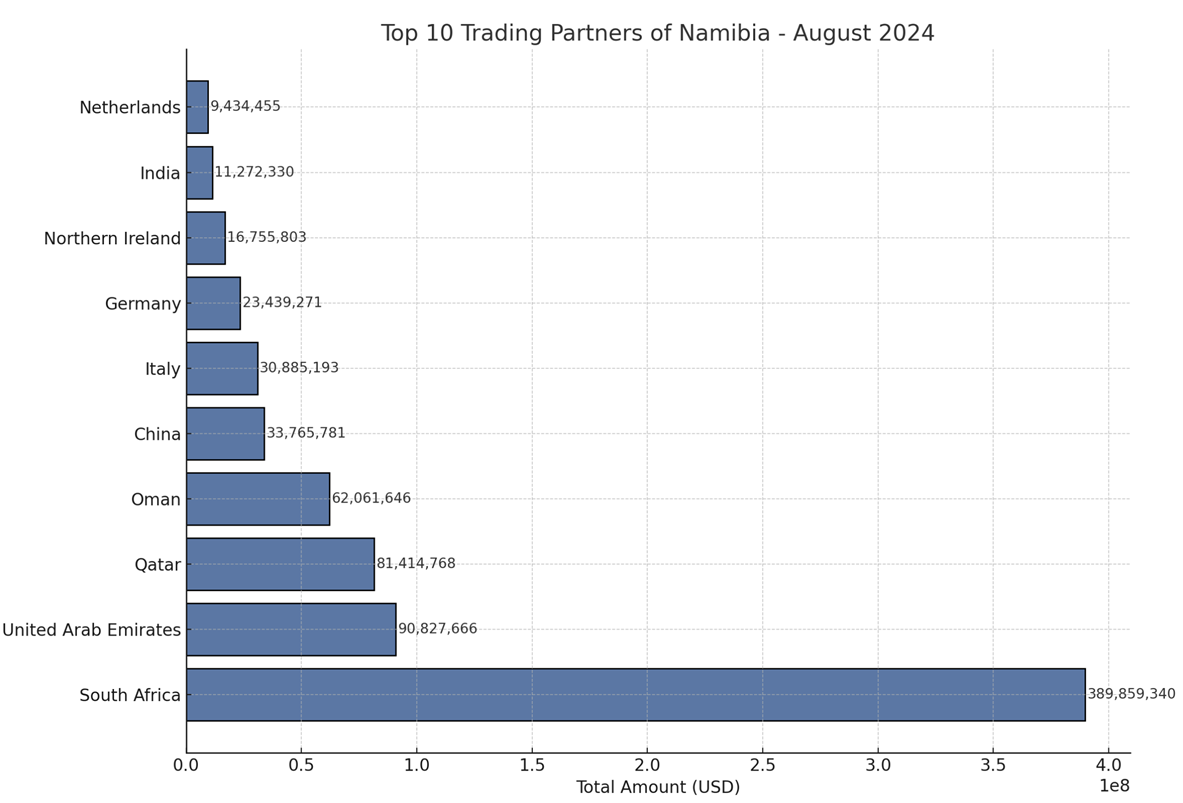
South Africa
As Namibia's largest trading partner, South Africa recorded a total of 165,241 transactions this month, with a total trade value reaching USD 389,859,340. Although the month-on-month trade value decreased by USD 20,031,887, it showed a year-on-year increase of USD 19,581,419, highlighting South Africa’s stable presence in the Namibian market. South Africa's main export products to Namibia include food, mineral fuels, and machinery, making it a primary supplier to the Namibian market.
United Arab Emirates
This month, the United Arab Emirates exported goods worth USD 90,827,666 to Namibia. Despite a month-on-month decrease of USD 33,447,583, the trade value increased by USD 10,782,180 compared to the same period last year. This indicates the UAE’s strong competitive position in exporting electronic equipment and mineral products to Namibia.
Qatar
Qatar saw a significant increase in trade activity with Namibia this month, with a total trade value of USD 81,414,768. The value increased by USD 81,409,076 compared to the previous month, as new trade transactions were established. Qatar's main export products include liquefied natural gas (LNG) and other energy products, signaling an expanding cooperation between Qatar and Namibia in the energy sector.
Oman
Oman’s total trade value with Namibia for this month reached USD 62,061,646, a month-on-month increase of USD 62,031,688. However, this represents a year-on-year decrease of USD 16,550,368, indicating significant trade fluctuations. This suggests the need to closely monitor future trade trends and cooperation between Oman and Namibia.
China
The total export value from China to Namibia this month was USD 33,765,781, a month-on-month decrease of USD 28,532,657. Nevertheless, it marked a year-on-year increase of USD 6,406,121. China’s main exports to Namibia include machinery and consumer goods. Despite short-term fluctuations, overall demand remains strong, reflecting China’s sustained role as a key supplier to Namibia.
These key trading partners collectively shape Namibia's import market, with South Africa and China maintaining a significant presence. As Qatar and Oman expand their energy exports to Namibia, the dynamics of the Namibian import market are expected to continue evolving. Foreign trade enterprises can leverage these insights to explore new opportunities and establish stronger trade relations in the region.
Exchange Rate Analysis
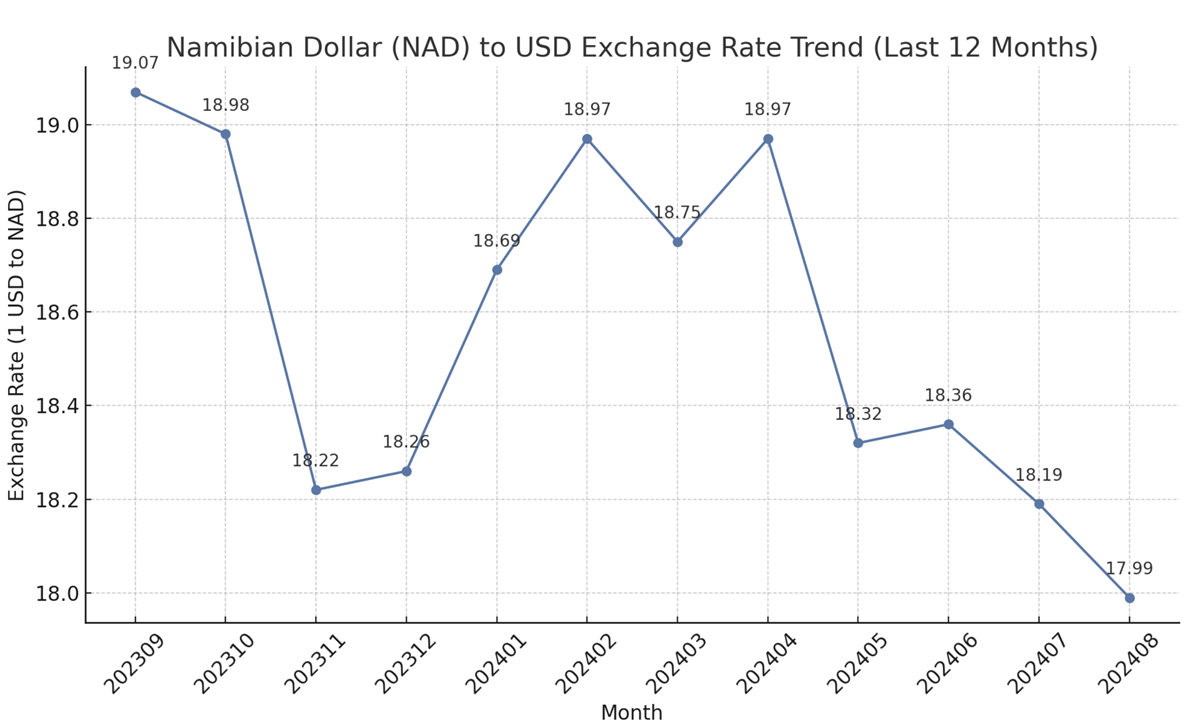
Overall Trend: Over the past year, the exchange rate of the Namibian Dollar (NAD) against the US Dollar (USD) has shown a fluctuating but overall declining trend, indicating that the Namibian Dollar has been appreciating against the US Dollar. The exchange rate gradually decreased from 19.07 NAD/USD in September 2023 to 17.99 NAD/USD in August 2024.
Notable Changes:
- November to December 2023: During this period, the exchange rate slightly increased from 18.22 to 18.26 NAD/USD, reflecting a relatively stable trend with minimal fluctuations.
- March to April 2024: The exchange rate rose from 18.75 to 18.97 NAD/USD, indicating a short-term depreciation of the Namibian Dollar against the US Dollar.
- Since May 2024: The exchange rate has gradually declined to 17.99 NAD/USD, showing a consistent appreciation of the Namibian Dollar, likely influenced by domestic economic policy adjustments or a weakening of the US Dollar.
Future Trend Forecast
Based on the current trend, the Namibian Dollar is expected to continue appreciating slightly against the US Dollar in the coming months. This projection is driven by the following factors:
- Recovery of Namibia's Domestic Economy: A stable and recovering domestic economy could strengthen the purchasing power of the Namibian Dollar.
- Global Weakening of the US Dollar: If the US Dollar continues to weaken, the Namibian Dollar is likely to experience further appreciation.
It is recommended to closely monitor the global economic situation and any adjustments to Namibia’s domestic monetary policies, as these will be crucial factors in determining the future trend of the exchange rate.
Conclusion
The Namibian import market in August 2024 showed significant changes in various aspects. Overall, although the total import value declined this month, the increase in the number of importers indicates growing diversity and activity in market demand. Among the major imported products, mineral fuels and light vehicles remain the mainstays of Namibia’s import market, while beer and malt beverages exhibited strong growth, reflecting an increase in local consumption demand.
Regarding key trading partners, South Africa, China, and the United Arab Emirates continue to be Namibia’s most important partners, with South Africa holding the largest market share. Notably, emerging markets such as Oman and Qatar have shown rapid growth in exports to Namibia, indicating their potential to become significant players in the Namibian import market in the future.
In terms of exchange rates, the Namibian Dollar (NAD) has generally appreciated against the US Dollar over the past 12 months. This trend could be attributed to local economic policies and a weakening US Dollar. If Namibia’s domestic economy remains stable, it is expected that the exchange rate will continue to show relative strength in the coming months.
For foreign trade enterprises, understanding Namibia’s market demand and buyer information, especially focusing on product categories with increased import values and active buyers this month, such as beer and medium passenger vehicles, can help capture market opportunities. Furthermore, closely monitoring exchange rate fluctuations and global economic conditions can assist companies in formulating better trade strategies. NBD Data (en.nbd.ltd), as a provider of the latest and most comprehensive foreign trade data analysis, will continue to offer accurate market intelligence and professional trade data support for businesses and individuals.
Disclaimer: The data and analysis in this report are derived from NBD Data's statistical results and may contain some errors. Users should verify these data independently. NBD Data is not responsible for any consequences arising from the use of this report's information.


