Cameroon August Import Data Overview: Understand Market Dynamics and Seize Opportunities!
As a key economy in Africa, Cameroon's import market dynamics are of significant reference value to global traders. The latest import data for August 2024 has just been released, providing fresh insights into market trends for foreign trade companies, logistics enterprises, and market analysts. This report reveals the overall performance of Cameroon's import market with a special focus on imports from China. It offers a detailed analysis of the August import data to help you seize business opportunities and understand market trends.
Overview of Cameroon’s Import Data for August:
In August 2024, Cameroon recorded a total of 45,185 import entries, which is a decrease of 3,909 entries compared to July, showing a month-on-month decline of approximately 7.96%. Compared to the same period last year, the total number of entries increased by 1,541, marking a year-on-year growth of about 3.53%. Despite some fluctuations in the number of entries, the total import value for this month reached approximately $1.113 billion, which is a 36.45% decrease compared to last month’s $1.751 billion. Year-on-year, this also represents a 34.19% decrease compared to $1.691 billion in the previous year.
Regarding buyers, the total number of import buyers in Cameroon in August was 4,289, a decrease of 83 buyers from the previous month, down by about 1.90%. However, compared to the same period last year, there was a significant increase, with 437 more buyers, representing an 11.35% year-on-year growth. The number of suppliers also fluctuated; there were 4,595 suppliers this month, down by 333 from 4,928 last month, a 6.76% month-on-month decrease. Nevertheless, compared to the 4,334 suppliers in the same period last year, there was an increase of 261, which is a 6.02% year-on-year growth.
These data reflect the overall performance of Cameroon’s import market in August. Although the total import value declined, the increase in the number of buyers and suppliers indicates that market vitality remains. Next, we will further explore the segmentation of imported goods in Cameroon, with a particular focus on the performance of Chinese goods in this market.
Top Five Imported Products in Cameroon for August:
In August 2024, the variety of goods imported into Cameroon was diverse, with the top five categories showing significant market trends.
Crude Oil and Related Products (HS Code: 270900):
This month, the total import value of crude oil and related products was $227 million, a 38.76% decrease from $370 million last month and a 64.86% drop compared to $646 million in the same period last year. This indicates a noticeable downward trend in crude oil imports, possibly related to fluctuations in international oil prices, changes in domestic demand, and energy policy adjustments.Petroleum Products (HS Code: 271019):
Liquid petroleum products such as lubricants and fuel are Cameroon’s second-largest import category this month, with a total value of approximately $85.2 million. This represents a slight month-on-month increase of about 2.23% compared to $83.3 million last month. However, there is a 26.49% year-on-year decrease compared to $116 million last year, indicating that despite a decrease in total imports, the demand for these petroleum products remains relatively stable.Milled Rice (HS Code: 100630):
This month, the import value of milled rice reached $42.56 million, showing a 7.84% month-on-month increase and a substantial 63.79% year-on-year growth. Compared to last month’s $39.46 million, there was an increase of approximately $3.09 million, and a rise of about $16.57 million from $25.98 million in the same period last year. The growth in milled rice imports, a staple food in Cameroon, may reflect a rising domestic demand for this grain or an easing of import policies.Gasoline (HS Code: 271012):
The import value of gasoline products this month was $39.75 million, a decrease of 38.16% month-on-month and 57.45% year-on-year compared to $93.38 million in the same period last year. This significant downward trend may reflect adjustments in Cameroon’s domestic economic conditions, changes in fuel consumption policies, or the impact of international oil prices.Hard Wheat (HS Code: 100199):
Cameroon’s total import value for hard wheat this month was $33.45 million, a substantial month-on-month increase of 125.22% and a 33.02% year-on-year increase compared to $25.15 million in the same period last year. As an important food ingredient, the significant increase in wheat imports may indicate a rising domestic demand for wheat products.
Overall, the composition of Cameroon’s imported goods in August shows that energy products (crude oil, petroleum products, gasoline) and food products (milled rice, hard wheat) still occupy a large share. However, while the import value of energy products is generally declining, the import of food products is showing a growth trend. This change may be related to the global economic situation, fluctuations in international market prices, and adjustments in Cameroon’s domestic policies.
Top Buyers for Major Imported Products in Cameroon:
Focusing on the main product categories in Cameroon’s import market for August 2024, here are the top buyers for each category along with their import value, month-on-month, and year-on-year changes.
Crude Oil and Related Products (HS Code: 270900):
- STE NAT DES HYDROCARBURES (snh.cm)
- Import Value This Month: $88.83 million, Last Month: $340 million (Decrease of $251.97 million), Last Year: $0 (Increase of $88.83 million)
- PERENCO RIO DEL REY (perenco.com)
- Import Value This Month: $83.87 million, Last Month: $0 (Increase of $83.87 million)
- ADDAX PETROLEUM CAMEROON COMPANY S A (addaxpetroleum.com)
- Import Value This Month: $54.14 million, Last Month: $0 (Increase of $54.14 million), Last Year: $646 million (Decrease of $591.49 million)
- STE NAT DES HYDROCARBURES (snh.cm)
Petroleum Products (HS Code: 271019):
- NEPTUNE OIL (neptuneenergy.com)
- Import Value This Month: $29.08 million, Last Month: $13.24 million (Increase of $15.84 million), Last Year: $15.42 million (Increase of $13.66 million)
- TRADEX S.A. (tradex.es)
- Import Value This Month: $24.84 million, Last Month: $10.16 million (Increase of $14.68 million), Last Year: $13.91 million (Increase of $10.93 million)
- TOTAL CAMEROUN S.A. (totalenergies.cm)
- Import Value This Month: $9.29 million, Last Month: $15.37 million (Decrease of $6.08 million), Last Year: $14.93 million (Decrease of $5.64 million)
- NEPTUNE OIL (neptuneenergy.com)
Milled Rice (HS Code: 100630):
- AFRICAINE DE LA DISTRIBUTION MODERNE (africadistribution-group.com)
- Import Value This Month: $14.77 million, Last Month: $0.163 million (Increase of $14.61 million)
- OLAM CAMEROUN S.A. (olamgroup.com)
- Import Value This Month: $14.27 million, Last Month: $1.70 million (Increase of $12.56 million), Last Year: $2.08 million (Increase of $12.18 million)
- PROGRAMME ALIMENTAIRE MONDIAL (fr.wfp.org)
- Import Value This Month: $4.99 million, Last Month: $3.29 million (Increase of $1.70 million), Last Year: $2.18 million (Increase of $2.81 million)
- AFRICAINE DE LA DISTRIBUTION MODERNE (africadistribution-group.com)
Gasoline (HS Code: 271012):
- TRADEX S.A. (tradex.es)
- Import Value This Month: $31.33 million, Last Month: $9.60 million (Increase of $21.72 million), Last Year: $8.14 million (Increase of $23.19 million)
- VISION ENERGY S.A (visionenergy.com)
- Import Value This Month: $5.59 million, Last Month: $0 million (Increase of $5.59 million)
- TOTAL CAMEROUN S.A. (totalenergies.cm)
- Import Value This Month: $2.72 million, Last Month: $22.02 million (Decrease of $19.30 million), Last Year: $54.25 million (Decrease of $51.54 million)
- Hard Wheat (HS Code: 100199):
- STE AFISA FOOD INDUSTRY S.A. (elnefeidi.com)
- Import Value This Month: $9.21 million, Last Month: $1.76 million (Increase of $7.45 million), Last Year: $3.92 million (Increase of $5.29 million)
- OLAM CAMEROUN S.A. (olamgroup.com)
- Import Value This Month: $6.78 million, Last Month: $0 million (Increase of $6.78 million)
- LA PASTA S.A. (cadyst.com)
- Import Value This Month: $5.61 million, Last Month: $2.22 million (Increase of $3.39 million), Last Year: $1.93 million (Increase of $3.68 million)
These top buyers reflect Cameroon’s demand for various goods, particularly in energy and food sectors. Understanding their purchasing behavior provides valuable insights for suppliers and traders to develop more targeted market strategies.
Cameroon’s Main Trade Partners:
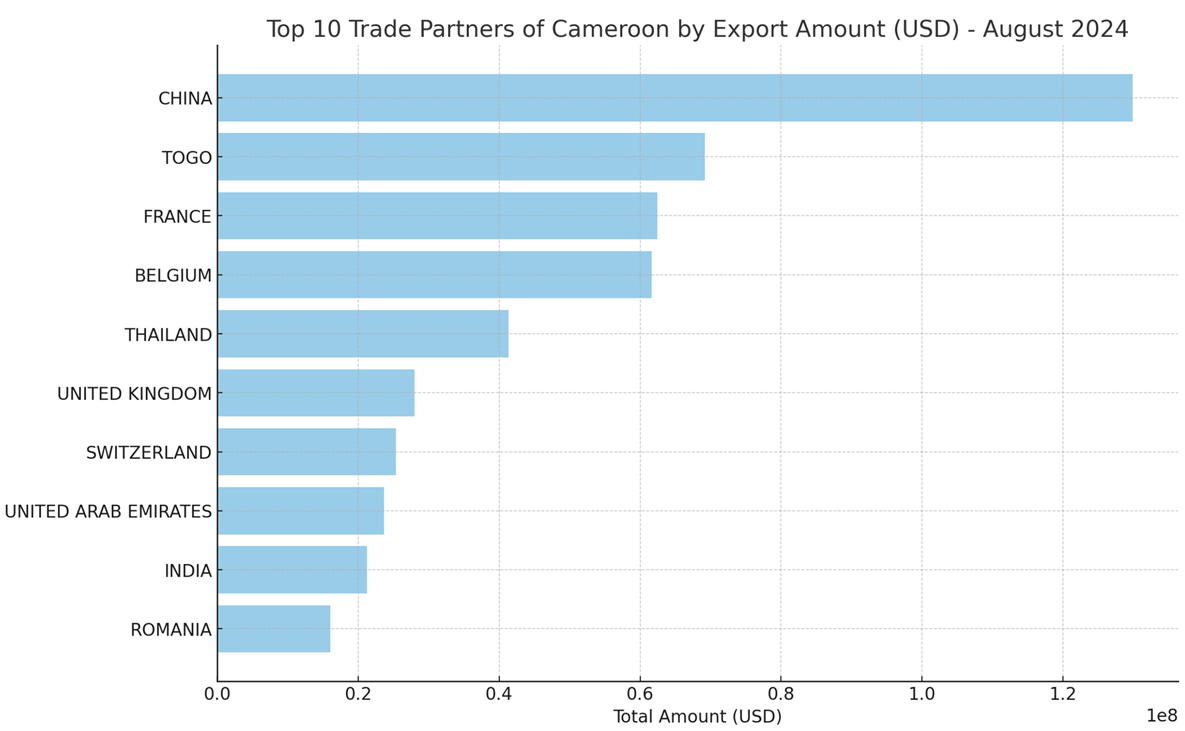
In August 2024, Cameroon's main trade partners showed a diversified pattern. Below is an analysis of Cameroon’s top ten trade partners:
China (CHINA):
China continues to be Cameroon’s largest trade partner, with a total export value of approximately $130 million this month. However, compared to last month, the export value decreased by about $43.8 million, showing a significant month-on-month decrease. This could be related to market demand or trade policy adjustments. Nevertheless, there was still a year-on-year growth, with an increase of approximately $8.88 million.Togo (TOGO):
Togo ranks second with an export value of $69.18 million. Although there was a decrease of about $8.76 million month-on-month, the year-on-year decrease was even more pronounced, reaching approximately $13.46 million, indicating a downward trend in trade value.France (FRANCE):
France remains one of Cameroon’s main trade partners, but this month’s export value saw a significant decline, decreasing by approximately $14.36 million compared to last month and $47.71 million year-on-year. This decline may be influenced by various factors such as market fluctuations in Europe or supply chain issues.Belgium (BELGIUM):
Belgium’s export value to Cameroon this month is about $61.62 million, a month-on-month increase of approximately $17.01 million, but a decrease of about $8.08 million compared to the same period last year. Despite the month-on-month growth, the overall trade value remains below last year's level.Thailand (THAILAND):
Thailand stands out this month as a remarkable trade partner, with an export value of $41.31 million. This represents a month-on-month increase of approximately $33.43 million and a year-on-year growth of about $39.64 million. This surge may be due to Thailand’s increased efforts in developing the Cameroonian market or the popularity of emerging products in Cameroon.United Kingdom (UNITED KINGDOM):
The UK also saw an improvement in its export performance to Cameroon this month, with a total value of approximately $28 million, representing an increase of about $17.19 million month-on-month and $22.79 million year-on-year. This growth may be associated with the UK's expansion strategy in the African market.Switzerland (SWITZERLAND):
Switzerland’s export value to Cameroon this month is around $25.31 million, which is a decrease of about $13.51 million month-on-month and $30.75 million year-on-year. The reduction in trade value may be influenced by changes in the global market.United Arab Emirates (UNITED ARAB EMIRATES):
The UAE’s export value to Cameroon this month is approximately $23.65 million, with a slight month-on-month increase of about $1.5 million and a year-on-year increase of about $8.34 million, indicating strengthening trade ties between the UAE and Cameroon.India (INDIA):
India remains an important trade partner for Cameroon, but the export value this month is about $21.23 million, a month-on-month decrease of approximately $9.55 million and a year-on-year decrease of about $21.34 million. This could be related to changes in the Indian domestic market or adjustments in international trade policies.Romania (ROMANIA):
Romania’s export value to Cameroon this month is about $16.01 million, showing a substantial month-on-month increase of approximately $14.66 million and a year-on-year increase of about $15.79 million. Romania’s rapid growth in the Cameroonian market is noteworthy and may be due to a rise in demand for certain specific products or the strengthening of trade cooperation.
Conclusion:
The import data for Cameroon in August 2024 reflects diverse market dynamics. Although the total import value has declined, the growth in the number of buyers and suppliers indicates that market vitality remains. Major imported goods in Cameroon include energy products such as crude oil and petroleum products, which hold a significant position. However, their import value shows a downward trend, possibly related to fluctuations in international oil prices and changes in domestic demand. Meanwhile, the import value of food products such as milled rice and hard wheat has increased, indicating rising domestic demand for these foods.
In terms of trade partners, China continues to be Cameroon’s largest trade partner. Despite a month-on-month decrease, there is still a year-on-year growth. Other major trade partners, including Togo, France, and Belgium, have shown varying export performances, with some experiencing significant fluctuations. Notably, Thailand and Romania have performed well this month, with substantial growth in export value, possibly due to their proactive market expansion or increased demand for certain products in Cameroon.
By analyzing these data, foreign trade companies, importers, and market analysts can better understand the trends in Cameroon’s import market, enabling them to formulate more effective trade strategies. NBD Data, through its professional customs data, foreign trade data, and import-export data analysis, is dedicated to providing clients with the latest market information and in-depth market insights, helping businesses succeed in the Cameroon import market.
Disclaimer: The data and analysis in this report are derived from NBD Data's statistical results and may contain some errors. Users should verify these data independently. NBD Data is not responsible for any consequences arising from the use of this report's information.
For more detailed data, please visit NBD Data's official website: en.nbd.ltd


