Revealing! Côte d'Ivoire Import Data Latest Release: Top Five Products Unveiled!

Publishing Date:2024-09-18 17:15:42 Source: NBD Data(en.nbd.ltd)

Recently, we conducted a comprehensive analysis of Côte d'Ivoire's customs import data for August 2024, offering insights into the latest trends in the import market. This analysis covers the total number of imported goods, total value, and the number of buyers and suppliers. Through this data, we can gain an overview of the overall dynamics of the Côte d'Ivoire import market and the performance of various product categories. Whether you are an international trade company, a logistics provider, or a market analysis professional, this report will provide valuable insights.

Overview of Côte d'Ivoire Import Data for August 2024

In August 2024, the Côte d'Ivoire customs import data recorded a total of 66,368 entries, a decrease of 1,599 entries from the previous month, marking a month-on-month decline of 2.35%. Compared to the same period last year, there was a decrease of 1,521 entries, representing a year-on-year decrease of 2.24%. The total import value for this month reached $2.83 billion, a decrease of $476 million from the previous month, down by 14.4% month-on-month; compared to the same period last year, it decreased by $716 million, down by 20.2%.

The number of buyers this month was 2,519, a decrease of 59 compared to the previous month, down by 2.29% month-on-month; compared to the same period last year, the number of buyers decreased by 98, a year-on-year decline of 3.75%. Meanwhile, the total number of suppliers this month was 9,357, a decrease of 143 compared to the previous month's 9,500, marking a month-on-month decline of 1.51%. It is worth noting that due to the unavailability of data from the same period last year, the year-on-year change could not be calculated.

Overall, the import market in Côte d'Ivoire showed signs of contraction this month, with decreases in the total number of imports, total value, and the number of buyers and suppliers. This trend may be influenced by various factors such as the global economic environment and changes in market demand. Next, we will delve into the import categories in August 2024 and the specifics of imports from China.

Côte d'Ivoire's Top Five Imported Goods for August

In August 2024, the top five imported goods in Côte d'Ivoire were mainly concentrated in petroleum products and mechanical parts:

  1. HS Code 271012 - Light Oils & Preparations: The total import value this month reached $790 million, showing a 23.3% increase compared to the same period last year. This indicates a steady demand for light oil products amid the growing global energy demand.

  2. HS Code 271019 - Lubricating Oils & Related Products: The total import value was approximately $733 million, down by 3.8% year-on-year. These products are primarily used in industrial and automotive sectors. The decline in both month-on-month and year-on-year comparisons could be linked to recent market price fluctuations and demand changes.

  3. HS Code 270900 - Crude Oil & Crude Oil Products: The total import value this month was $103 million, marking a month-on-month decrease of 66.4% and a year-on-year decrease of 69.6%. The significant drop in crude oil imports may be due to fluctuations in global crude oil market supply and demand, as well as price adjustments.

  4. HS Code 848180 - Mechanical Equipment Parts (Faucets, Valves, etc.): The total import value this month was about $46.4 million, with a month-on-month surge of 1209.8% and a year-on-year growth of 970.8%. The sharp increase in demand for mechanical equipment parts could be related to the advancement of Côte d'Ivoire's domestic industry and infrastructure construction.

  5. HS Code 271113 - Liquefied Natural Gas (LNG): The total import value this month was approximately $38.5 million, showing a 9.4% increase year-on-year. As a clean energy source, LNG has seen steady demand growth in the global market in recent years.

Recommended Côte d'Ivoire Buyers for Major Products

This month, the import market in Côte d'Ivoire featured several noteworthy buyers across different product categories:

  1. HS Code 271012 - Light Oils & Preparations

    • GESTOCI-STE DE GESTION:

      • Purchase Amount: $387,183,917
      • Month-on-month Growth: $32,347,603
      • Year-on-year Growth: $34,591,315
      • Website: gestoci.ci
      • A key player in the energy sector, showing steady demand for light oil products with increases in both month-on-month and year-on-year figures.
    • PETROCI HOLDING:

      • Purchase Amount: $229,497,086
      • Month-on-month Growth: $32,191,898
      • Year-on-year Growth: $229,497,086 (no purchase in the same period last year)
      • Website: petroci.ci
      • A state-owned oil company in Côte d'Ivoire, showing significant growth in the light oil market.
    • SIR (SOCIETE IVOIRIENNE RAFFINAGE):

      • Purchase Amount: $67,343,193
      • Month-on-month Decrease: $-69,030,573
      • Year-on-year Growth: $67,343,193 (no purchase in the same period last year)
      • Website: sir.ci
      • A major refinery company with a significant increase year-on-year, indicating a possible influence of market dynamics on their procurement strategy.
  2. HS Code 271019 - Lubricating Oils & Related Products

    • GESTOCI-STE DE GESTION:

      • Purchase Amount: $408,503,477
      • Month-on-month Growth: $46,205,884
      • Year-on-year Growth: $12,029,567
      • Website: gestoci.ci
      • Shows steady demand for these products with positive growth in both month-on-month and year-on-year comparisons.
    • PETROCI HOLDING:

      • Purchase Amount: $131,191,833
      • Month-on-month Decrease: $-49,233,378
      • Year-on-year Growth: $131,191,833 (no purchase in the same period last year)
      • Website: petroci.ci
      • The company shows a slight decline month-on-month but an overall increase year-on-year, indicating a strategic adjustment in their procurement.
    • VIVO ENERGY CI:

      • Purchase Amount: $74,976,552
      • Month-on-month Growth: $3,992,770
      • Year-on-year Growth: $9,765,017
      • Website: vivoenergy.com
      • Exhibits a steady growth trend in the lubricating oil market, with positive figures in both month-on-month and year-on-year comparisons.
  3. HS Code 270900 - Crude Oil & Crude Oil Products

    • SIR (SOCIETE IVOIRIENNE RAFFINAGE):
      • Purchase Amount: $102,804,740
      • Month-on-month Decrease: $-202,741,860
      • Year-on-year Decrease: $-235,152,030
      • Website: sir.ci
      • Displays a significant decrease in crude oil purchases, likely influenced by fluctuations in global crude oil prices or changes in domestic demand.
  4. HS Code 848180 - Mechanical Equipment Parts (Faucets, Valves, etc.)

    • BAKER HUGHES EHO LTD.:

      • Purchase Amount: $43,692,404
      • Month-on-month and Year-on-year Growth: $43,692,404 (no purchase in the previous month or same period last year)
      • Website: bakerhughes.com
      • Showed outstanding performance in mechanical equipment parts, indicating potential business expansion in the Côte d'Ivoire market.
    • FADCO COMPANY:

      • Purchase Amount: $394,211
      • Month-on-month Growth: $5,744
      • Year-on-year Growth: $394,211 (no purchase in the same period last year)
      • Website: fadcoksa.com
      • Shows stable demand for mechanical equipment parts with positive month-on-month and year-on-year growth.
    • OLAM COCOA PROCESSING CI:

      • Purchase Amount: $319,394
      • Month-on-month Growth: $311,412
      • Year-on-year Growth: $284,779
      • Website: fmo.nl
      • Exhibits significant growth in the demand for mechanical equipment parts.

Côte d'Ivoire's Major Trade Partners

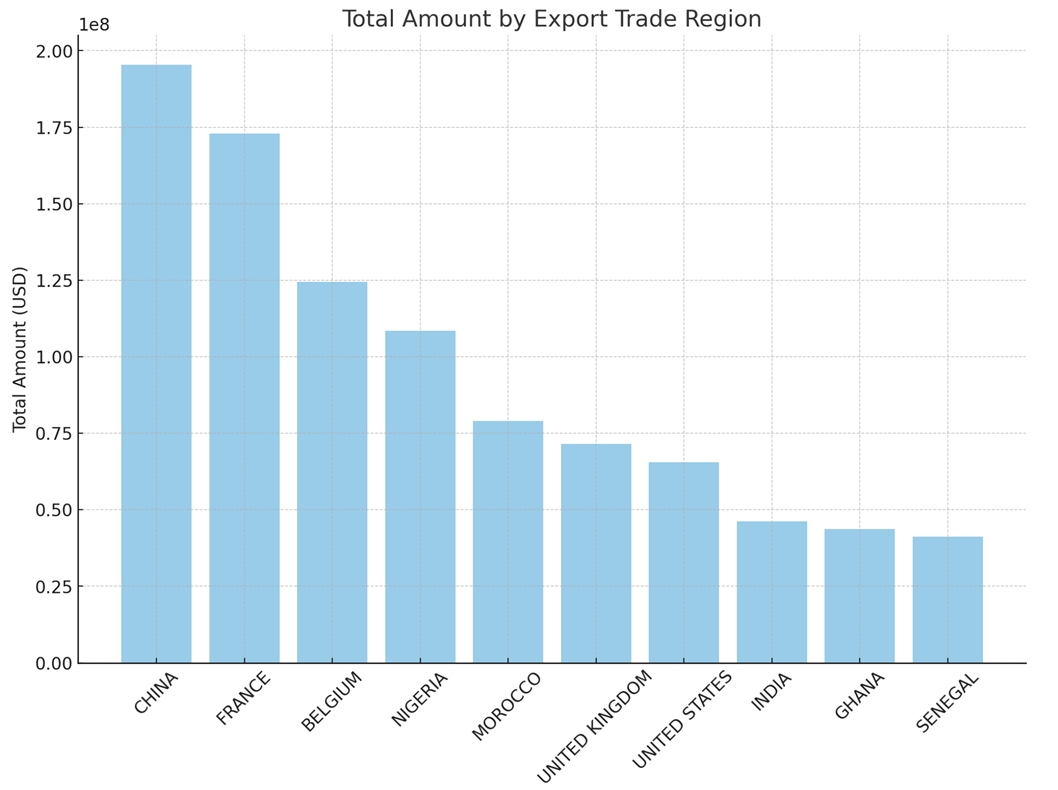
In August 2024, China and France continued to dominate as Côte d'Ivoire's top trade partners:

  • China: Maintains its position as the largest trade partner with a total export value of $195 million, though there was a month-on-month decrease of $9.89 million (5.4%) and a year-on-year decrease of $26.76 million (12%). Despite this decline, China remains a key partner, offering a diverse range of export goods.

  • France: The total export value amounted to $173 million, with a month-on-month increase of $19.16 million (12.5%) and a year-on-year increase of $3.09 million (1.8%). France continues to show steady growth in trade with Côte d'Ivoire, highlighting the strength of their trade relationship.

  • Belgium: Exported goods worth $124 million, with a significant month-on-month decrease of $71.09 million (36.4%) but a year-on-year increase of $33.43 million (37%). The month-on-month decline may be due to market demand fluctuations, while the year-on-year growth indicates enhanced trade relations.

  • Nigeria: The export value was $108 million, showing a sharp month-on-month decrease of $133 million (55.2%) and a year-on-year decrease of $240 million (68.8%). This significant drop may be attributed to macroeconomic conditions and changes in trade policies.

  • Morocco: Exported goods valued at $79 million, with a month-on-month decrease of $12.09 million (13.3%) and a year-on-year decrease of $57.58 million (42%). Morocco's market share in Côte d'Ivoire has declined, possibly due to intensified competition or price fluctuations.

  • United Kingdom: Exported $71.58 million worth of goods, with a substantial month-on-month increase of $58.27 million (437.7%) and a year-on-year increase of $51.51 million (257%). The surge in export value may be driven by increased demand in specific sectors or products.

  • United States: The export value was $65.57 million, with a month-on-month increase of $29.51 million (81.8%) and a year-on-year increase of $44.51 million (211%). The U.S. shows remarkable export growth, indicating a competitive edge in certain market areas.

  • India: Exported goods valued at $46.26 million, with a month-on-month increase of $7.75 million (20.1%) but a year-on-year decrease of $31.52 million (40.5%). The mixed performance may reflect changes in commodity prices or market demand.

  • Ghana: The export value was $43.75 million, showing a slight month-on-month decrease of 2.04% and a marginal year-on-year decline. Ghana's trade with Côte d'Ivoire remains relatively stable with minimal fluctuations.

  • Senegal: Exported goods valued at $41.25 million, with a month-on-month decrease of 6.8% but a significant year-on-year increase of 91.5%. This indicates a growth trend in trade with Côte d'Ivoire.

Overall, the data reveals that China and France remain the most important trade partners for Côte d'Ivoire, with varying changes in export values. Countries like Nigeria and Morocco have experienced notable declines in exports, likely due to a range of influencing factors. In contrast, the United Kingdom and the United States have shown strong growth momentum, indicating a competitive position in the Côte d'Ivoire market.

Conclusion

The Côte d'Ivoire import market in August 2024 exhibits a diversified development trend. The primary imported goods are concentrated in petroleum, mechanical parts, and agriculture-related products. As for major trade partners, China and France continue to lead, while countries like the United Kingdom and the United States show strong growth. All these data points highlight the dynamic changes in Côte d'Ivoire's foreign trade data, customs data, and import-export data. By analyzing this data, we gain deeper insights into the development trends of Côte d'Ivoire's import market, providing valuable support for international trade companies and market analysts.

Disclaimer: The data and analysis in this report are derived from NBD Data's statistical results and may contain some errors. Users should verify these data independently. NBD Data is not responsible for any consequences arising from the use of this report's information.

For more detailed data, please visit NBD Data's official website: en.nbd.ltd

Related Recommendations

Offer

Ecuador’s July 2025 Imports Surge 14.05% to $3.19 Billion, Led by U.S. and China Trade

2025-08-11 17:42:09

In July 2025, Ecuador’s import activity experienced a significant upswing, with total imports reaching $3.19 billion, marking a 14.05% increase compared to $2.80 billion in June. This growth was supported by 1,638,334 transaction records, underscoring strong trade activity and the resilience of the country’s import sector amid evolving global market conditions.Six-Month Trend AnalysisOver the past six months, Ecuador’s import value has demonstrated a steady upward trend, peaking in July after a moderate dip in June. February recorded $2.78 billion in imports, followed by a slight decline in March to $2.68 billion. April and May saw renewed momentum at $2.74 billion and $2.89 billion, respectively, before a drop to $2.80 billion in June. July’s rebound to $3.19 billion coincided with a notable contraction in the number of domestic importers, from 113,403 in June to 65,277 in July, suggesting concentration of larger import transactions among fewer but possibly more capital-intensive companies. Transaction volumes mirrored this contraction, dropping from 1.92 million records in June to 1.64 million in July, indicating a possible shift toward high-value goods.Top 10 Trade PartnersThe United States maintained its position as Ecuador’s top import partner in July, supplying goods worth $829 million. This trade involved 50,738 Ecuadorian importers and 2,744 U.S. suppliers, covering 2,369 product categories, with petroleum products, machinery, and electronics being key sectors.China ranked second with $682 million in imports, driven by high volumes of manufactured goods, industrial machinery, and electronics. A total of 5,389 Ecuadorian importers engaged with 6,020 Chinese suppliers, covering 2,639 categories.Panama followed with $253 million in trade, a notable share given its smaller supplier base of 261 companies serving 1,655 Ecuadorian importers. This reflects Panama’s role as a regional logistics hub for petroleum derivatives and re-exports.Colombia ranked fourth with $183 million, involving 1,721 Ecuadorian importers and 1,297 Colombian suppliers, spread across 1,526 categories, with agricultural commodities and construction materials being prominent.The remaining six partners—Peru, Brazil, Spain, Italy, Chile, and Argentina—collectively contributed a diversified import portfolio exceeding $5.0 billion annually, reflecting strong regional and intercontinental ties.Fastest-Growing Trade PartnersCambodia recorded an unprecedented surge to $55,485 from only $6 last month, reflecting a 890,513.16% growth, likely due to a large one-off shipment in textiles or specialty goods.Myanmar saw imports rise to $7,849, a 1,891.83% jump, suggesting the beginning of small-scale trade channels.Bolivia surged to $16.32 million, up 1,450.33%, largely in minerals and food products.Morocco posted $121,231, up 1,084.70%, possibly linked to increased demand for specialized industrial materials.Kuwait expanded its exports to Ecuador to $34,323, up 882.82%, potentially tied to petrochemical products.Commodity Trends and HS Code AnalysisThe fastest-growing commodity in July was HS 270750Aromatic hydrocarbon mixtures, which surged 122.28% to $220.11 million. Key buyers included EMPRESA PUBLICA DE HIDROCARBUROS DEL ECUADOR EP PETROECUADOR($130.02 million), EMPRESA DE HIDROCARBUROS DEL ECUADOR EP PETROECUADOR($89.86 million), and INDUSTRIAL LATINA S.A..HS 870121(Motor vehicles for the transport of persons, diesel-powered) grew 54.53% to $13.87 million, with major importers such as INDUSUR INDUSTRIAL DEL SUR S. A.and COMERCIAL CARLOS ROLDAN CIA. LTDA..HS 842952(Mechanical shovels, excavators, and shovel loaders with 360° rotation) increased 52.62% to $21.04 million, led by IASA S.A.and DITECA S.A.HS 852872(Color television reception apparatus) rose 50.90% to $15.30 million, with leading buyers including INTELLCARD S.A.and CAR SOUNDVISION CIA. LTDA..HS 390210(Polypropylene in primary forms) grew 50.87% to $12.36 million, with PLASTICSACKS CIA LTDA.and OBEN ECUADOR S.A.among the top buyers.Ecuador’s import sector in July 2025 displayed strong performance, underpinned by surging demand for hydrocarbons, machinery, and consumer electronics. The dominance of the U.S. and China reflects sustained global trade connectivity, while the rise of smaller partners such as Cambodia and Bolivia highlights evolving trade diversification. With energy-related imports leading the surge, Ecuador is positioned for continued trade growth, though the concentration among fewer importers suggests a strategic pivot toward large-scale, high-value transactions....

Offer

May 2025 Trade Snapshot: Colombia’s Imports Rise by 5.87%, Led by U.S. and China

2025-08-01 14:24:07

In May 2025, Colombia's total import value reached $6.13 billion, reflecting a 5.87% increase from April’s $5.79 billion. This uptick was supported by an expansion in trade activity, as the country recorded 331,782 import transactions across the month. The surge also coincided with a rise in active importers, underscoring a robust recovery in demand across key industrial sectors.Over the past six months, Colombia’s import volume demonstrated a steady upward trend, particularly after a dip in early 2025. From December 2024’s $5.65 billion, the figure declined slightly in January and February, followed by consecutive growth through March, April, and May. Notably, the number of domestic import companies climbed from 11,709 in February to 13,205 in May, while the total monthly transaction count increased by over 30,000 entries within the same period. This suggests growing commercial engagement and a diversification in sourcing activity.Among Colombia’s top ten import partners in May 2025, the United States maintained its leading position with $1.747 billion in trade value. A total of 4,258 Colombian importers were active in transactions with the U.S., involving 2,745 suppliers and over 5,700 product categories—a testament to the deep and varied commercial ties, particularly in pharmaceuticals, machinery, and electronics.China ranked second with $913 million in imports. Trade was conducted by 5,809 Colombian companies sourcing from 2,785 Chinese exporters, encompassing over 8,300 distinct product categories, the highest among all partners. This highlights China’s role as a broad-spectrum supplier, especially in consumer electronics and industrial goods.Panama stood out with $341 million in trade, facilitated by 774 Colombian firms and 1,658 Panamanian suppliers. As a strategic transshipment and re-export hub, Panama’s importance lies in its logistical advantage and flexibility across diverse commodity types.Switzerland followed closely with $325 million in imports. Although involving a relatively modest 385 Colombian importers, they engaged with 1,136 Swiss exporters in high-value segments such as chemicals, precision instruments, and medical devices.The remaining six partners—Brazil, Mexico, Germany, Korea, Chile, and even Colombia itself (for intra-national re-importation)—collectively contributed a significant volume of diversified imports. Their combined presence underscores the geographic and sectoral variety in Colombia’s external trade ecosystem.The fastest-growing trade relationships in May were led by Moldova, which recorded a 22,017.78% month-on-month surge, reaching $475,859 from just $2,151 in April. While the absolute figure remains modest, this exponential rise may reflect a new trade channel opening, likely involving agricultural or chemical goods.Croatia and Malta also saw dramatic increases—4,977.76% and 2,777.82% respectively—suggesting emerging niche trade flows or first-time large-volume contracts. Meanwhile, Andorra’s 1,689% surge and Morocco’s significant jump to $3.25 million (+714.16%) reinforce the trend of Colombia tapping into less traditional sourcing markets for specific categories.From a product perspective, urea-based nitrogenous fertilizers (HS Code 310210) topped the growth charts, up 156.48% month-on-month to $41 million. Major importers included PRECISAGRO S.A.S., NITROFERT S.A.S, and ARARAS NUTRICION S A S, reflecting heightened demand in Colombia’s agribusiness sector.In the machinery segment (HS Code 847989), imports surged nearly 100%, led by EMGESA S A ESP, THE ELITE FLOWER SAS C I, and ENERLAND 2007 FOTOVOLTAICA SL, pointing to expansion in energy and automation sectors.Television and video display equipment (HS Code 852872) recorded an 87.11% jump, with top importers such as SAMSUNG ELECTRONICS COLOMBIA S.A., ALKOSTO S.A., and LG ELECTRONICS COL LTDA.responding to rising consumer electronics demand.Pharmaceuticals (HS Code 300215) also grew significantly, with leading firms like ASTRAZENECA COLOMBIA S.A.S., MERCK SHARP AND DOHME COLOMBIA S A S, and PRODS ROCHE S Ashowing strong activity.The most valuable category remained light petroleum oils (HS Code 271012), which rose by 41.99% to a massive $325.9 million. Key importers included ECOPETROL S.A., REFINERIA DE CARTAGENA S.A, and FRONTERA ENERGY COL CORP SUC COL, underscoring continued demand from Colombia’s refining and energy sectors.In conclusion, Colombia’s import performance in May 2025 signals strong momentum, especially in high-value sectors such as energy, electronics, machinery, and agrochemicals. The rise in both volume and diversity of trade partners suggests growing resilience and complexity in the country’s trade structure. Moving forward, continued monitoring of emerging partners and product categories will be key to understanding Colombia’s evolving import dynamics....

Offer

Panama’s Import Performance in June 2025: U.S. and China Lead, Congo Surges

2025-07-30 00:24:43

Panama imported goods worth $1.23 billion in June 2025, reflecting a 4.82% decline from May’s total of $1.29 billion. The number of records filed reached 145,966, and 5,400 domestic importers were active during the period. This moderate month-on-month contraction indicates shifting demand patterns and possible seasonality effects across several key sectors.Over the past six months, Panama’s import value has fluctuated between $1.16 billion and $1.29 billion. January 2025 started strong at $1.26 billion, followed by minor volatility through April. May marked the highest value in the half-year window before June’s decline. The number of domestic importers remained stable, peaking in May with 5,452 active companies. Record volumes followed a similar trajectory, aligning closely with total trade activity.The United States remained Panama’s top trading partner in June, contributing $205 million to the import total. This trade involved 1,840 Panamanian importers and 2,929 U.S. suppliers, with goods spanning 2,276 categories. The U.S. continues to serve as Panama’s key source of industrial, technological, and agricultural products.Close behind was China, with $199 million in imports. 1,927 local buyers sourced from 3,179 Chinese exporters, covering 2,025 product types. This reflects China’s strength in consumer goods, electronics, and intermediate inputs.Mexico took third position at $55 million, with a balanced ecosystem of 485 Panamanian importers and 793 Mexican suppliers, indicating strong regional ties and cost-efficient logistics. Costa Rica followed with $41 million, backed by 308 Panamanian companies trading with 393 Costa Rican partners across 400 goods—a testament to Central American intra-regional trade.Colombia, Spain, Japan, Brazil, and Guatemala rounded out the top ten. Collectively, these partners added significant diversity, contributing both high-tech goods and essential commodities. Their combined presence underscores Panama’s multi-sourced procurement strategy.Among the fastest-growing sources of imports, Congo surged an astonishing 29,033.63%, albeit from a low base, reaching $8,524 in June. Luxembourg followed with a 2,016.73% increase, hitting $124,941. Serbia, Moldova, and Zaire all posted triple-digit percentage gains. While these countries contribute marginally in absolute terms, such spikes often signal emerging trade lanes or one-time strategic deliveries.On the product side, the top-performing categories showed impressive growth. Leading the charge was HS 100119 [wheat and meslin (excluding seed)], which surged 92.11% to $9.79 million. Key buyers included HARINAS DEL ISTMO S.A., GOLD MILLS DE PANAMA S A, and HARINERA ORO DEL NORTE.HS 230990 [non-retail dog/cat food] rose 72.13% to $10.46 million, led by EL ROBLE DEL RIO, S.A. and others.HS 854449 [low-voltage electric conductors]gained 51.91%, with major players including VIAKABLE PANAMA, S.A..HS 870333 [diesel vehicles over 2500cc]and HS 230400 [soybean oilcake and residues] grew 23.40% and 22.46%, respectively, reflecting demand in Panama’s transportation and livestock sectors.In conclusion, Panama’s import activity in June 2025 displayed mild contraction in value yet vibrant diversification across suppliers and products. The United States and China continue to dominate the landscape, while explosive growth from smaller economies signals emerging patterns worth monitoring. Agricultural goods, pet nutrition, and electric components drove product-level momentum, pointing to sustained consumption and infrastructure investment. Looking ahead, these dynamics position Panama for adaptive sourcing in a changing global trade environment....