Uruguay Customs Import Data Update - July 2024

Publishing Date:2024-08-09 15:42:48 Source: NBD Data(en.nbd.ltd)

I. Overall Data Overview

In July 2024, Uruguay's import activities demonstrated significant growth, reflecting the country's robust demand in the global supply chain. Despite a 13.78% month-on-month decrease in the total number of import records and a 10.55% year-on-year decrease, the total import value surged. The total import value for this month reached USD 1.89 billion, representing a 21.73% increase from the previous month and an 11.81% increase compared to the same period last year. This growth indicates strong demand for high-value goods in Uruguay.

The number of active buyers also increased this month, reaching 5,467, a rise of 8.09% month-on-month and 6.67% year-on-year. This data suggests a more dynamic market with increased participation from various enterprises.

II. Top 5 Imported Product Categories

Uruguay's top five imported product categories in July 2024 showed diverse demand across different sectors:

  1. HS Code 470329 - Other Pulp: The total import value for this category was USD 180.78 million, marking a 50.58% month-on-month increase and a 60.21% year-on-year increase. This significant growth underscores the strong demand for raw materials in Uruguay's industrial sector.

  2. HS Code 271600 - Electrical Energy Products: This category maintained a stable import value of USD 112 million, with no month-on-month change but a substantial 47.37% year-on-year increase. This stability reflects Uruguay's ongoing investments in energy supplies.

  3. HS Code 270900 - Crude Oil and Petroleum Products: The total import value for this category was USD 87.06 million. Despite having no import data for the previous month, this category saw a 12.67% year-on-year increase, indicating continued demand for petroleum in Uruguay.

  4. HS Code 300490 - Pharmaceutical Products: This category saw an import value of USD 52.11 million, with a 35.99% month-on-month increase but a 4.72% year-on-year decrease. This fluctuation reflects the dynamic nature of the pharmaceutical market.

  5. HS Code 330210 - Fragrances and Flavors: The import value for this category was USD 42.22 million, with a 4.47% month-on-month decrease but a 3.52% year-on-year increase, suggesting a stable demand for fragrance products.

III. Top 5 Products Imported from the United States

The following are the top five product categories imported from the United States to Uruguay:

  1. HS Code 330300 - Perfume and Cosmetics: The total import value for this category was USD 5.21 million, reflecting a 5.10% month-on-month decrease and a 13.88% year-on-year decrease. Despite these declines, cosmetics remain a key import from the U.S.

  2. HS Code 852872 - Television Receivers: This category experienced a significant month-on-month increase of 120.23% and a 156.87% year-on-year increase, with a total import value of USD 3.75 million. The strong demand for electronics is evident in these figures.

  3. HS Code 841510 - Air Conditioning Machines: The import value for this category was USD 1.40 million, showing a remarkable 707.08% month-on-month increase and a 519.70% year-on-year increase. The surge in demand for air conditioning units is particularly noteworthy.

  4. HS Code 220830 - Whisky: This category saw a total import value of USD 1.21 million, reflecting a 22.43% month-on-month decrease and a 25.90% year-on-year decrease. The decline may suggest changes in consumer preferences or market conditions.

  5. HS Code 220421 - Wine: The total import value for wine was USD 1.01 million, with a 140.91% month-on-month decrease and a 29.42% year-on-year decrease, indicating a significant drop in wine imports.

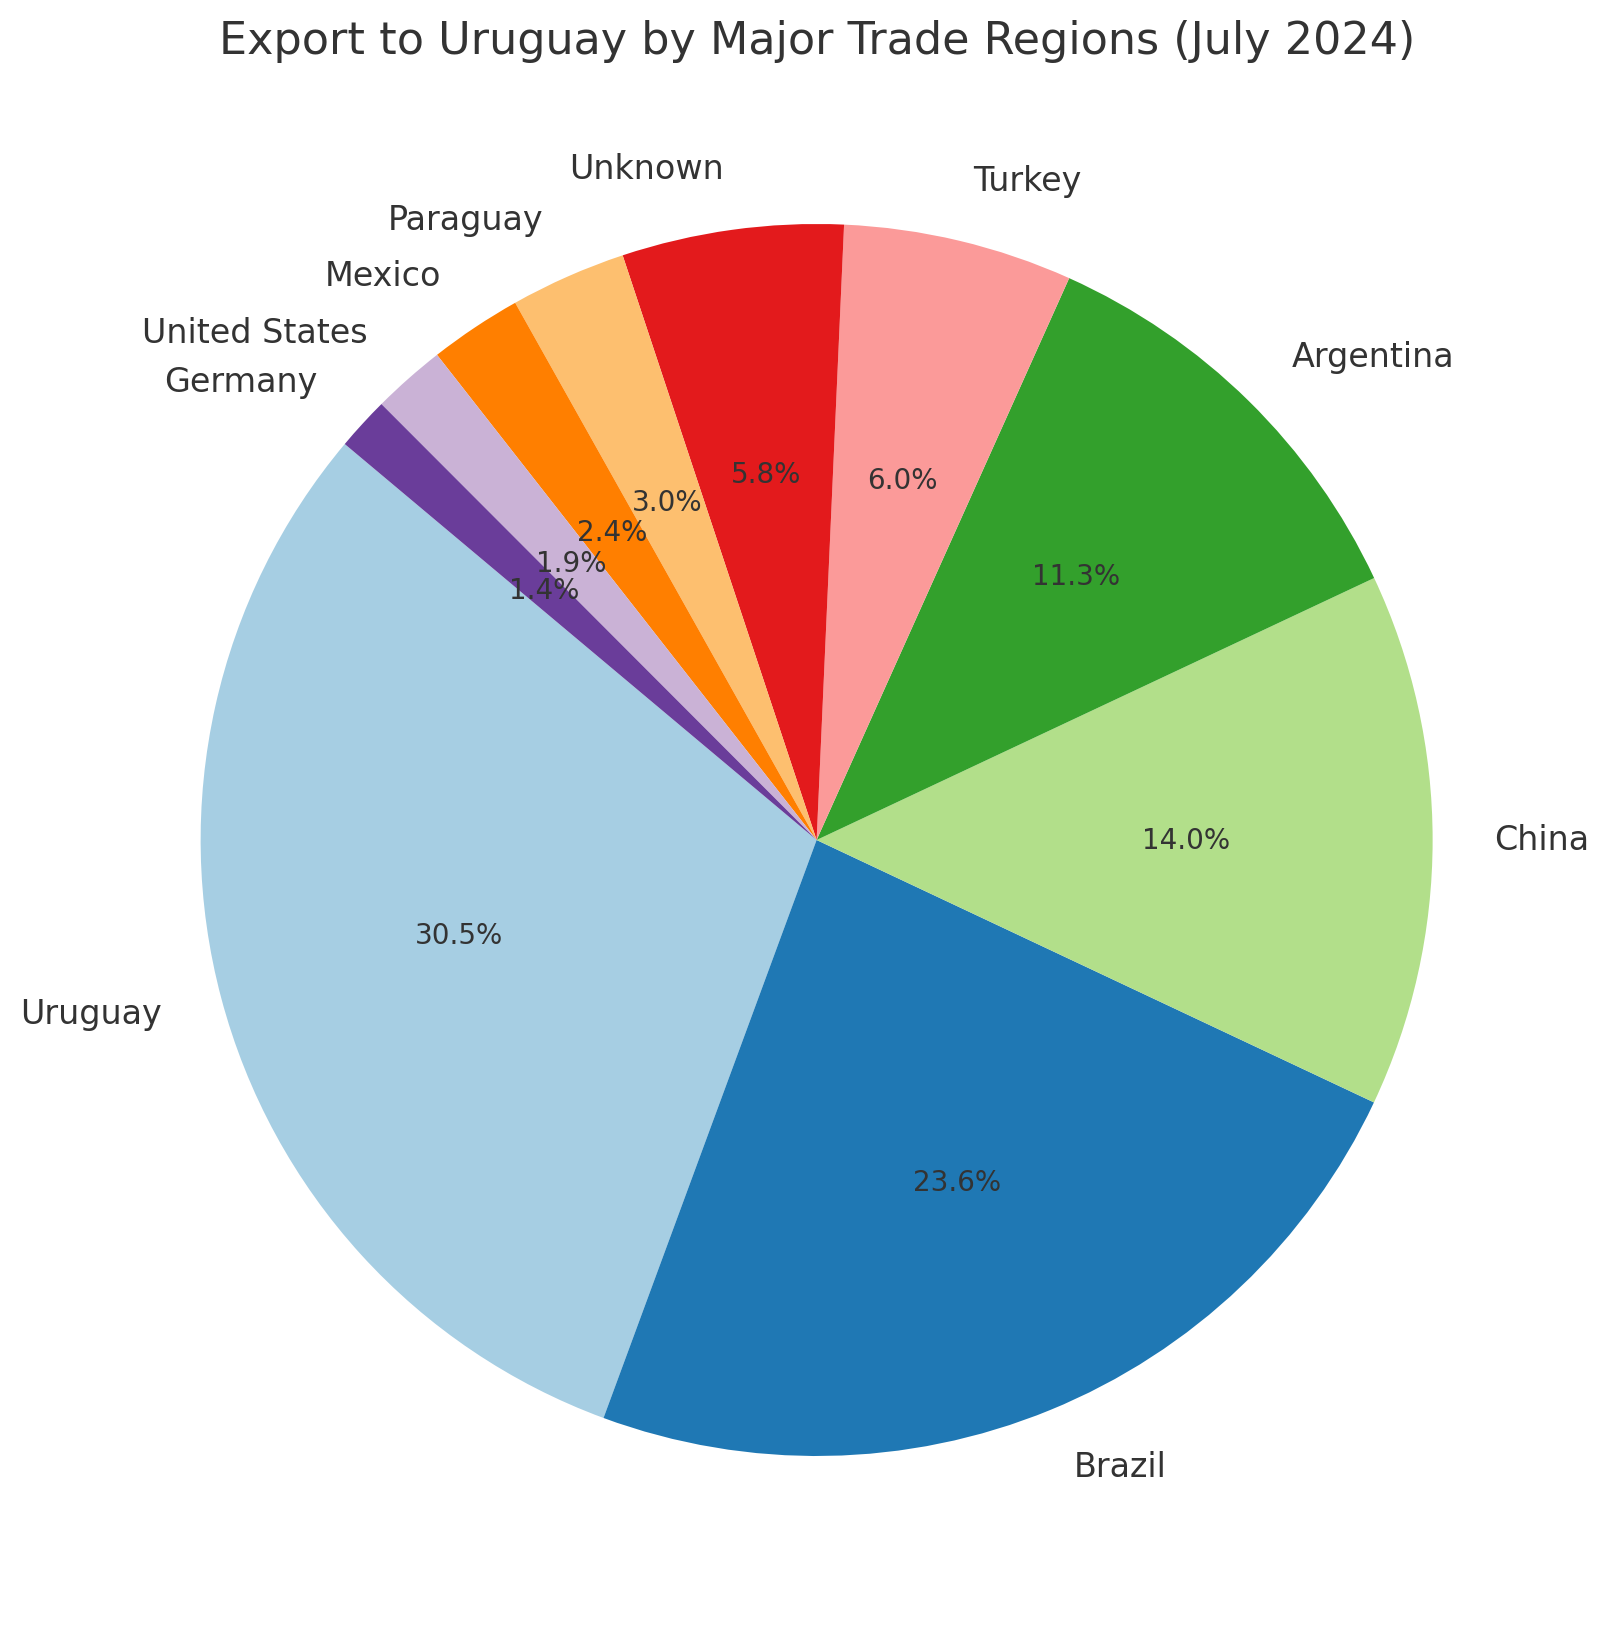
IV. Top 10 Trade Regions Exporting to Uruguay

Uruguay's import sources were diverse, with the top 10 regions contributing significantly to the overall import value:

  1. Uruguay (Domestic Imports): Totaling USD 483.12 million, this category saw a 23.49% month-on-month increase and a 10.80% year-on-year increase, indicating a strong internal trade flow.

  2. Brazil: Imports from Brazil reached USD 374.25 million, with a 17.56% month-on-month increase and a 26.17% year-on-year increase, reflecting robust trade ties.

  3. China: Imports from China amounted to USD 221.76 million, with a 36.48% month-on-month increase and a 50.38% year-on-year increase, highlighting China's growing importance as a trade partner.

  4. Argentina: Argentina's exports to Uruguay totaled USD 178.82 million, showing a 16.25% month-on-month increase but a 19.63% year-on-year decrease, suggesting possible shifts in trade dynamics.

  5. Turkey: Imports from Turkey surged to USD 95.29 million, a staggering 1027.28% month-on-month increase and a 590.25% year-on-year increase, indicating a dramatic rise in trade activity.

  6. Unknown: Imports from unknown regions totaled USD 92.03 million, with a 13.46% month-on-month increase and a 19.86% year-on-year increase, reflecting growing trade from less defined regions.

  7. Paraguay: Imports from Paraguay reached USD 48.17 million, with a 37.44% month-on-month increase but a 17.96% year-on-year decrease, showing mixed trends.

  8. Mexico: Imports from Mexico totaled USD 38.49 million, a 17.24% month-on-month decrease but a 4.03% year-on-year increase, indicating moderate trade activity.

  9. United States: Imports from the U.S. amounted to USD 30.41 million, with a 21.76% month-on-month increase and a 19.96% year-on-year increase, maintaining the U.S.'s strong trade presence.

  10. Germany: Imports from Germany totaled USD 22.22 million, with a 3.70% month-on-month decrease and a 13.69% year-on-year decrease, reflecting a decline in trade with Germany.

Conclusion

Uruguay's import activity in July 2024 showed strong growth, particularly in high-value product categories such as energy products, pharmaceuticals, and automotive components. The data suggests that Uruguay's demand for essential goods and advanced technologies remains strong. NBD Data will continue to monitor global market trends to provide the most accurate and up-to-date customs data analysis to help businesses capitalize on emerging opportunities.

Disclaimer: The data and analysis in this report are derived from NBD Data's statistical results and may contain some errors. Users should verify these data independently. NBD Data is not responsible for any consequences arising from the use of this report's information.

For more detailed information, please visit NBD Data's official website.

Related Recommendations

Offer

Ecuador’s July 2025 Imports Surge 14.05% to $3.19 Billion, Led by U.S. and China Trade

2025-08-11 17:42:09

In July 2025, Ecuador’s import activity experienced a significant upswing, with total imports reaching $3.19 billion, marking a 14.05% increase compared to $2.80 billion in June. This growth was supported by 1,638,334 transaction records, underscoring strong trade activity and the resilience of the country’s import sector amid evolving global market conditions.Six-Month Trend AnalysisOver the past six months, Ecuador’s import value has demonstrated a steady upward trend, peaking in July after a moderate dip in June. February recorded $2.78 billion in imports, followed by a slight decline in March to $2.68 billion. April and May saw renewed momentum at $2.74 billion and $2.89 billion, respectively, before a drop to $2.80 billion in June. July’s rebound to $3.19 billion coincided with a notable contraction in the number of domestic importers, from 113,403 in June to 65,277 in July, suggesting concentration of larger import transactions among fewer but possibly more capital-intensive companies. Transaction volumes mirrored this contraction, dropping from 1.92 million records in June to 1.64 million in July, indicating a possible shift toward high-value goods.Top 10 Trade PartnersThe United States maintained its position as Ecuador’s top import partner in July, supplying goods worth $829 million. This trade involved 50,738 Ecuadorian importers and 2,744 U.S. suppliers, covering 2,369 product categories, with petroleum products, machinery, and electronics being key sectors.China ranked second with $682 million in imports, driven by high volumes of manufactured goods, industrial machinery, and electronics. A total of 5,389 Ecuadorian importers engaged with 6,020 Chinese suppliers, covering 2,639 categories.Panama followed with $253 million in trade, a notable share given its smaller supplier base of 261 companies serving 1,655 Ecuadorian importers. This reflects Panama’s role as a regional logistics hub for petroleum derivatives and re-exports.Colombia ranked fourth with $183 million, involving 1,721 Ecuadorian importers and 1,297 Colombian suppliers, spread across 1,526 categories, with agricultural commodities and construction materials being prominent.The remaining six partners—Peru, Brazil, Spain, Italy, Chile, and Argentina—collectively contributed a diversified import portfolio exceeding $5.0 billion annually, reflecting strong regional and intercontinental ties.Fastest-Growing Trade PartnersCambodia recorded an unprecedented surge to $55,485 from only $6 last month, reflecting a 890,513.16% growth, likely due to a large one-off shipment in textiles or specialty goods.Myanmar saw imports rise to $7,849, a 1,891.83% jump, suggesting the beginning of small-scale trade channels.Bolivia surged to $16.32 million, up 1,450.33%, largely in minerals and food products.Morocco posted $121,231, up 1,084.70%, possibly linked to increased demand for specialized industrial materials.Kuwait expanded its exports to Ecuador to $34,323, up 882.82%, potentially tied to petrochemical products.Commodity Trends and HS Code AnalysisThe fastest-growing commodity in July was HS 270750Aromatic hydrocarbon mixtures, which surged 122.28% to $220.11 million. Key buyers included EMPRESA PUBLICA DE HIDROCARBUROS DEL ECUADOR EP PETROECUADOR($130.02 million), EMPRESA DE HIDROCARBUROS DEL ECUADOR EP PETROECUADOR($89.86 million), and INDUSTRIAL LATINA S.A..HS 870121(Motor vehicles for the transport of persons, diesel-powered) grew 54.53% to $13.87 million, with major importers such as INDUSUR INDUSTRIAL DEL SUR S. A.and COMERCIAL CARLOS ROLDAN CIA. LTDA..HS 842952(Mechanical shovels, excavators, and shovel loaders with 360° rotation) increased 52.62% to $21.04 million, led by IASA S.A.and DITECA S.A.HS 852872(Color television reception apparatus) rose 50.90% to $15.30 million, with leading buyers including INTELLCARD S.A.and CAR SOUNDVISION CIA. LTDA..HS 390210(Polypropylene in primary forms) grew 50.87% to $12.36 million, with PLASTICSACKS CIA LTDA.and OBEN ECUADOR S.A.among the top buyers.Ecuador’s import sector in July 2025 displayed strong performance, underpinned by surging demand for hydrocarbons, machinery, and consumer electronics. The dominance of the U.S. and China reflects sustained global trade connectivity, while the rise of smaller partners such as Cambodia and Bolivia highlights evolving trade diversification. With energy-related imports leading the surge, Ecuador is positioned for continued trade growth, though the concentration among fewer importers suggests a strategic pivot toward large-scale, high-value transactions....

Offer

May 2025 Trade Snapshot: Colombia’s Imports Rise by 5.87%, Led by U.S. and China

2025-08-01 14:24:07

In May 2025, Colombia's total import value reached $6.13 billion, reflecting a 5.87% increase from April’s $5.79 billion. This uptick was supported by an expansion in trade activity, as the country recorded 331,782 import transactions across the month. The surge also coincided with a rise in active importers, underscoring a robust recovery in demand across key industrial sectors.Over the past six months, Colombia’s import volume demonstrated a steady upward trend, particularly after a dip in early 2025. From December 2024’s $5.65 billion, the figure declined slightly in January and February, followed by consecutive growth through March, April, and May. Notably, the number of domestic import companies climbed from 11,709 in February to 13,205 in May, while the total monthly transaction count increased by over 30,000 entries within the same period. This suggests growing commercial engagement and a diversification in sourcing activity.Among Colombia’s top ten import partners in May 2025, the United States maintained its leading position with $1.747 billion in trade value. A total of 4,258 Colombian importers were active in transactions with the U.S., involving 2,745 suppliers and over 5,700 product categories—a testament to the deep and varied commercial ties, particularly in pharmaceuticals, machinery, and electronics.China ranked second with $913 million in imports. Trade was conducted by 5,809 Colombian companies sourcing from 2,785 Chinese exporters, encompassing over 8,300 distinct product categories, the highest among all partners. This highlights China’s role as a broad-spectrum supplier, especially in consumer electronics and industrial goods.Panama stood out with $341 million in trade, facilitated by 774 Colombian firms and 1,658 Panamanian suppliers. As a strategic transshipment and re-export hub, Panama’s importance lies in its logistical advantage and flexibility across diverse commodity types.Switzerland followed closely with $325 million in imports. Although involving a relatively modest 385 Colombian importers, they engaged with 1,136 Swiss exporters in high-value segments such as chemicals, precision instruments, and medical devices.The remaining six partners—Brazil, Mexico, Germany, Korea, Chile, and even Colombia itself (for intra-national re-importation)—collectively contributed a significant volume of diversified imports. Their combined presence underscores the geographic and sectoral variety in Colombia’s external trade ecosystem.The fastest-growing trade relationships in May were led by Moldova, which recorded a 22,017.78% month-on-month surge, reaching $475,859 from just $2,151 in April. While the absolute figure remains modest, this exponential rise may reflect a new trade channel opening, likely involving agricultural or chemical goods.Croatia and Malta also saw dramatic increases—4,977.76% and 2,777.82% respectively—suggesting emerging niche trade flows or first-time large-volume contracts. Meanwhile, Andorra’s 1,689% surge and Morocco’s significant jump to $3.25 million (+714.16%) reinforce the trend of Colombia tapping into less traditional sourcing markets for specific categories.From a product perspective, urea-based nitrogenous fertilizers (HS Code 310210) topped the growth charts, up 156.48% month-on-month to $41 million. Major importers included PRECISAGRO S.A.S., NITROFERT S.A.S, and ARARAS NUTRICION S A S, reflecting heightened demand in Colombia’s agribusiness sector.In the machinery segment (HS Code 847989), imports surged nearly 100%, led by EMGESA S A ESP, THE ELITE FLOWER SAS C I, and ENERLAND 2007 FOTOVOLTAICA SL, pointing to expansion in energy and automation sectors.Television and video display equipment (HS Code 852872) recorded an 87.11% jump, with top importers such as SAMSUNG ELECTRONICS COLOMBIA S.A., ALKOSTO S.A., and LG ELECTRONICS COL LTDA.responding to rising consumer electronics demand.Pharmaceuticals (HS Code 300215) also grew significantly, with leading firms like ASTRAZENECA COLOMBIA S.A.S., MERCK SHARP AND DOHME COLOMBIA S A S, and PRODS ROCHE S Ashowing strong activity.The most valuable category remained light petroleum oils (HS Code 271012), which rose by 41.99% to a massive $325.9 million. Key importers included ECOPETROL S.A., REFINERIA DE CARTAGENA S.A, and FRONTERA ENERGY COL CORP SUC COL, underscoring continued demand from Colombia’s refining and energy sectors.In conclusion, Colombia’s import performance in May 2025 signals strong momentum, especially in high-value sectors such as energy, electronics, machinery, and agrochemicals. The rise in both volume and diversity of trade partners suggests growing resilience and complexity in the country’s trade structure. Moving forward, continued monitoring of emerging partners and product categories will be key to understanding Colombia’s evolving import dynamics....

Offer

Panama’s Import Performance in June 2025: U.S. and China Lead, Congo Surges

2025-07-30 00:24:43

Panama imported goods worth $1.23 billion in June 2025, reflecting a 4.82% decline from May’s total of $1.29 billion. The number of records filed reached 145,966, and 5,400 domestic importers were active during the period. This moderate month-on-month contraction indicates shifting demand patterns and possible seasonality effects across several key sectors.Over the past six months, Panama’s import value has fluctuated between $1.16 billion and $1.29 billion. January 2025 started strong at $1.26 billion, followed by minor volatility through April. May marked the highest value in the half-year window before June’s decline. The number of domestic importers remained stable, peaking in May with 5,452 active companies. Record volumes followed a similar trajectory, aligning closely with total trade activity.The United States remained Panama’s top trading partner in June, contributing $205 million to the import total. This trade involved 1,840 Panamanian importers and 2,929 U.S. suppliers, with goods spanning 2,276 categories. The U.S. continues to serve as Panama’s key source of industrial, technological, and agricultural products.Close behind was China, with $199 million in imports. 1,927 local buyers sourced from 3,179 Chinese exporters, covering 2,025 product types. This reflects China’s strength in consumer goods, electronics, and intermediate inputs.Mexico took third position at $55 million, with a balanced ecosystem of 485 Panamanian importers and 793 Mexican suppliers, indicating strong regional ties and cost-efficient logistics. Costa Rica followed with $41 million, backed by 308 Panamanian companies trading with 393 Costa Rican partners across 400 goods—a testament to Central American intra-regional trade.Colombia, Spain, Japan, Brazil, and Guatemala rounded out the top ten. Collectively, these partners added significant diversity, contributing both high-tech goods and essential commodities. Their combined presence underscores Panama’s multi-sourced procurement strategy.Among the fastest-growing sources of imports, Congo surged an astonishing 29,033.63%, albeit from a low base, reaching $8,524 in June. Luxembourg followed with a 2,016.73% increase, hitting $124,941. Serbia, Moldova, and Zaire all posted triple-digit percentage gains. While these countries contribute marginally in absolute terms, such spikes often signal emerging trade lanes or one-time strategic deliveries.On the product side, the top-performing categories showed impressive growth. Leading the charge was HS 100119 [wheat and meslin (excluding seed)], which surged 92.11% to $9.79 million. Key buyers included HARINAS DEL ISTMO S.A., GOLD MILLS DE PANAMA S A, and HARINERA ORO DEL NORTE.HS 230990 [non-retail dog/cat food] rose 72.13% to $10.46 million, led by EL ROBLE DEL RIO, S.A. and others.HS 854449 [low-voltage electric conductors]gained 51.91%, with major players including VIAKABLE PANAMA, S.A..HS 870333 [diesel vehicles over 2500cc]and HS 230400 [soybean oilcake and residues] grew 23.40% and 22.46%, respectively, reflecting demand in Panama’s transportation and livestock sectors.In conclusion, Panama’s import activity in June 2025 displayed mild contraction in value yet vibrant diversification across suppliers and products. The United States and China continue to dominate the landscape, while explosive growth from smaller economies signals emerging patterns worth monitoring. Agricultural goods, pet nutrition, and electric components drove product-level momentum, pointing to sustained consumption and infrastructure investment. Looking ahead, these dynamics position Panama for adaptive sourcing in a changing global trade environment....