Kenya’s Oil and Fuel Filter Imports Hit USD 6.79 Million in First Half of 2025

Publishing Date:2025-11-17 15:28:31 Source: NBD Data(en.nbd.ltd)

In the first half of 2025, Kenya’s imports of oil and fuel filters (HS code 84212300) reached a total value of USD 6,790,076, involving 1,996,203 units across 3,029 recorded shipments. According to data from NBD DATA, 47 source countries supplied filters to Kenya during this period, underscoring the country’s strong demand for automotive and industrial maintenance components as its transportation and agricultural sectors expand.

Monthly Trends

Kenya’s imports fluctuated slightly across the first half of the year but maintained a strong overall performance. The highest monthly import value was observed in February 2025, reaching USD 2.15 million, followed by steady inflows through May and June.

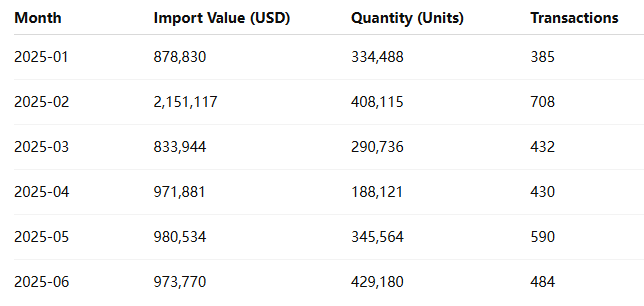
The data shows Kenya’s imports peaked early in the year, particularly in February, driven by pre-harvest season demand for agricultural machinery parts and replenishment of inventory by car service and parts distributors.

Market Overview

During January–June 2025, Kenya imported oil and fuel filters from 47 countries, engaging 468 importers and 699 exporters worldwide. This reflects an increasingly diversified supply chain and Kenya’s ongoing automotive industry growth.

Leading supplier nations included China, India, and Germany, which collectively accounted for over half of the import value. These countries dominate the production of oil and fuel filters used in commercial trucks, passenger vehicles, and construction equipment.

Product descriptions sampled from import data indicate a wide range of items such as engine oil filters, fuel filter cartridges, hydraulic filters, air/oil separators, and maintenance kits. Examples include:

  • “Caterpillar fuel/water separator filters”

  • “John Deere oil filter RE504836”

  • “Hengst oil filter (E500 KP02 D36)”

  • “Toyota genuine fuel filter assembly”

These products are typically used in the maintenance of engines for automobiles, tractors, and industrial generators — highlighting Kenya’s increasing reliance on imported components to sustain its fleet of imported machinery.

Top Kenyan Importers

According to NBD DATA, the top Kenyan importers of oil and fuel filters during this period were:

  1. Automotive Distributors Africa Ltd – A leading distributor handling multiple brands of oil and fuel filters, including Caterpillar and John Deere products.

  2. AMK International – Specialized in wholesale importation of automotive spare parts, particularly oil filters and engine components from China.

  3. Star Cargo Worldwide Ltd – Focused on logistics and bulk imports of automotive filters for both retail and OEM markets.

  4. ICS Agri Ltd – Supplies agricultural and industrial filters, including engine oil filters for tractors and farm equipment.

  5. Auto Parts Warehouse Kenya – A mid-sized importer catering to local garages and independent mechanics.

These companies form the core of Kenya’s filter supply chain, ensuring consistent availability of maintenance parts across the automotive and industrial sectors.

Leading Supplier Companies

Kenya’s main external suppliers were diverse but primarily concentrated in Asia and Europe. Among the most active exporters were:

  • Hengst Filters (Germany) – A globally recognized producer of premium automotive filters for both passenger and heavy-duty vehicles.

  • Ashok Leyland Ltd (India) – Exported specialized diesel engine filters, including water separators and fine fuel filtration systems.

  • Guangzhou Hangsheng Auto Parts Co., Ltd. (China) – Provided low-cost oil and fuel filters under private labels for regional distributors.

  • Atlas Copco (Sweden) – Supplied industrial compressor oil separators and maintenance kits.

  • John Deere (U.S.) – Exported agricultural and industrial engine filters for Kenyan distributors.

Together, these firms reflect Kenya’s wide import spectrum, ranging from low-cost aftermarket filters to OEM-grade components for high-end machinery.

Trade Regions

In the first half of 2025, Kenya sourced filters from 47 countries, but imports were highly concentrated among top regions:

  • Asia (China, India, South Korea, Japan) – ~60% of total imports

  • Europe (Germany, UK, Sweden, Italy) – ~25%

  • North America (USA) – ~10%

  • Other regions (UAE, South Africa, Turkey) – ~5%

This diversification ensures supply resilience, as Kenya benefits from competitive pricing in Asia and technical quality from Europe and the U.S.

China and India remain the cornerstone suppliers due to their strong export capabilities for aftermarket filters and components used in Kenya’s imported vehicle fleet — mostly second-hand Japanese and European cars.

Market Observation

Kenya’s demand for oil and fuel filters has expanded in parallel with the growth of its used-car market and industrial sectors. Importers have increasingly diversified sourcing to balance cost and quality — a trend evident in the rise of mid-tier brands like Hengst, Teson, and Klik Autotech alongside premium suppliers like John Deere and Caterpillar.

The agricultural machinery segment also contributed significantly to this growth, with filters imported for tractors, harvesters, and irrigation engines, particularly from India and China.

As the country continues to modernize its logistics and construction industries, the need for reliable filter systems — critical for reducing engine wear and improving efficiency — is expected to grow steadily.

Regional Focus: China

China remains Kenya’s largest single supplier of oil and fuel filters in both quantity and value. Chinese manufacturers such as Guangzhou Hangsheng and Jingling Auto Parts have captured a dominant share through affordable pricing and broad product compatibility.

Typical imported Chinese products include:

  • “Oil Filter for Toyota/Isuzu Models”

  • “Fuel Filter Element Assembly”

  • “Hydraulic Oil Separator”

These products are widely used in Kenya’s automobile servicing network, particularly by small and medium-sized workshops that rely on cost-effective parts.

Conclusion

Between January and June 2025, Kenya’s imports of oil and fuel filters (HS 84212300) totaled USD 6.79 million, with more than 1.99 million units imported from 47 countries. The market is dominated by suppliers from China and India, supported by European OEM brands offering high-end solutions.

This sustained import activity underlines Kenya’s expanding automotive maintenance industry and its crucial dependence on global suppliers for essential components. As vehicle ownership, agricultural mechanization, and industrial activity continue to grow, demand for filters is projected to remain robust in the second half of 2025.

Data source: Official import records analyzed by NBD DATA. For detailed trade tracking or supplier verification services, please visit https://en.nbd.ltd/service.

Related Recommendations

Offer

Analyzing India’s Spring Imports in 2025: Trade Flows, Top Buyers, and Regional Insights

2026-01-26 14:22:52

Springs, categorized under HS code73209090, play a crucial role in India’s industrial manufacturing chain, covering sectors from automotive and heavy machinery to electronics and oilfield equipment. As 2025 progressed, India’s import data for SPRINGreflected both the country’s expanding industrial demand and its reliance on globally specialized suppliers. According to trade intelligence from NBD DATA, India’s imports of mechanical springs continued to demonstrate strong growth in both value and shipment frequency.Market OverviewIn 2025, India imported a total of 91,744 spring shipments, valued at USD 71.86 million, involving 3,000 importers, 5,334 exporters, and 71 trading countries. The imported volume reached nearly 957 million units, with an aggregate weight of about 1.03 million kg. This high level of trade activity underscores India’s strong industrial consumption capacity and the continued integration of its manufacturing sector into the global component supply network.Common imported product types included:Valve and compression springs for automotive and machinery applications.Retaining and locking springs used in control valves and industrial fittings.Air springs and torsion springs for suspension and vibration control.Precision coil and disc springs for electronic assemblies and energy equipment.Sample imports recorded in NBD’s dataset include:“VALVE SPRING V12K PART NO 7618835”, “AIR SPRING ASSY 24C7201”, and “SPARE PARTS FOR FILLING MACHINES COMPRESSION SPRING 2522235 0000”, reflecting diverse mechanical use cases.Monthly Import PerformanceThroughout 2025, India’s spring import activity showed steady momentum, with a moderate seasonal peak during the second and third quarters — aligning with fiscal restocking and industrial production cycles.The value trend indicates consistent import levels, with May to July representing the most active phase. This reflects India’s mid-year production surge in automotive and mechanical assembly sectors.Market Observation: Key Importers and SuppliersTop Indian Importers of Springs (HS 73209090)SCHAEFFLER INDIA LIMITED– USD 5.57 millionFIBRO INDIA PRECISION PRODUCTS PRIVATE LIMITED– USD 1.84 millionHYOSUNG T & D INDIA PRIVATE LIMITED– USD 0.84 millionLESER INDIA PVT LTD– USD 0.65 millionTETRA PAK INDIA PRIVATE LIMITED– USD 0.32 millionThese leading Indian companies reflect diverse end-use industries. Schaeffler India supplies precision components to automotive and industrial systems, while Fibro India and Hyosung T&D specialize in manufacturing automation and power equipment. The presence of Leser India and Tetra Pak India emphasizes the import of springs for valves, packaging machinery, and process equipment — critical for the food, beverage, and energy sectors.Top Global Suppliers to IndiaSTROMSHOLMEN AB(Sweden) – USD 1.83 millionDENSO CORPORATION(Japan) – USD 1.43 millionAISIN CORPORATION(Japan) – USD 0.47 millionLESER GMBH & CO KG(Germany) – USD 0.59 millionM S SPECIAL SPRINGS S R L(Italy) – USD 0.34 millionGlobal supply leadership remains with high-precision European and Japanese manufacturers, indicating that India’s import preference tilts toward technologically advanced products used in automotive systems, compressors, and industrial machinery.Regional Trade DistributionIndia’s imports of springs during 2025 were sourced from 71 countries, reflecting a wide-reaching supply chain.The top contributors by shipment and value were as follows:China leads by shipment count, primarily serving India’s demand for mid-tier and low-cost automotive and industrial springs. Germany and Japan, however, account for higher per-unit value due to advanced manufacturing standards. The United States maintains relevance in oilfield and aerospace-grade spring exports. Italy and Sweden supply high-end industrial springs used in hydraulic and process systems.This diversified structure ensures resilience in India’s import supply chain, minimizing dependency on any single source market.Regional Focus: Trade with ChinaIn India’s 2025 spring imports, China remained the most frequent trading partner. With over 21,000 shipments, Chinese manufacturers supplied a significant portion of standard mechanical and precision springs used in machinery, electronics, and vehicles. The price-performance ratio from Chinese suppliers continues to attract Indian SMEs, especially those in Tier 2 and Tier 3 manufacturing clusters such as Pune, Ahmedabad, and Coimbatore.However, India’s sustained trade with Germany, Japan, and the U.S. indicates a dual sourcing strategy: importing cost-efficient items from Asia and high-specification parts from Europe and North America.Industrial InterpretationThe 2025 data highlights India’s strong industrial rebound, reflected by the high import frequency of precision and heavy-duty springs. Several macro trends can be inferred:Manufacturing Expansion – Consistent monthly imports reveal growing demand in India’s automotive and machinery production sectors.Technological Upgrade – Imports from advanced economies suggest increasing adoption of high-performance mechanical components.Supply Chain Diversification – India sources from 70+ countries, mitigating risk amid shifting global logistics.Investment Correlation – Foreign Direct Investment (FDI) in manufacturing complements the steady inflow of critical mechanical components like springs.ConclusionIndia’s import performance under HS 73209090 illustrates a balanced combination of cost efficiency and technology-driven sourcing. The USD 71.86 million trade value for 2025 confirms the importance of springs in sustaining industrial productivity and assembly-line operations across sectors. With 5,334 exporters and 3,000 importers, the ecosystem reflects a competitive, globalized market environment.Going forward, India is expected to retain a strong import flow of springs to support its expanding automotive, energy, and manufacturing sectors. At the same time, localized production will likely rise under the “Make in India” initiative, gradually reducing dependency on imports for standardized components while maintaining imports for advanced technologies.Data SourceAll quantitative data and trade intelligence in this report are based on 2025 import records from NBD DATA, processed through its verified trade database.For deeper analytics or enterprise-level data services, please visit the NBD DATA Service Portal....

Offer

Indonesia’s Women’s Pants Exports Reached 100 Thousand USD in 2024

2026-01-26 11:39:43

In 2024, Indonesia exported women’s trousers and similar woven garments under HS Code 62046200, with a total export value of USD 100,320. These shipments—listed under WOMEN PANT in customs data—show Indonesia’s ongoing role as a key player in global apparel manufacturing, particularly for mid-range and specialized fashion orders.According to NBD DATA, exports reached 14 destination countries, involving 30 exporters and 18 importers. Despite the small trade value, the data highlight Indonesia’s flexibility in fulfilling diverse, small-batch production for international brands and private labels.Quarterly Export OverviewExports of women’s trousers from Indonesia in 2024 displayed a strong seasonal pattern, with peaks in Q1 and Q4, aligning with international production and fashion cycles.Q4 2024 was the most active period, accounting for 43% of total annual exports, as overseas retailers increased orders before the year-end fashion season.Meanwhile, Q3 saw stable shipments supporting autumn inventory cycles, while Q1 recorded early-year production deliveries to long-term clients in Asia and North America.Overall, Indonesia exported approximately 9,403 pieces of women’s pants throughout 2024, averaging USD 10.7 per piece.Key Exporters and Industrial InsightsIndonesia’s women’s pants exports were led by several internationally recognized garment manufacturers:PT. TAINAN ENTERPRISES INDONESIA – A subsidiary of Tainan Group, specializing in high-quality woven trousers for global retail brands, contributing significantly to Indonesia’s export base.PT ANDALAN MANDIRI BUSANA – A key player in tailored apparel, producing for mid-tier labels and private collections.PT. CITRA ABADI SEJATI – Exported garments for international names such as L.L. Bean, known for compliance with ethical and environmental standards.UNGARAN SARI GARMENTS – Focused on precision garment making and small-volume premium orders.SANDANG ASIA MAJU ABADI – Exported USD 98,671 worth of women’s pants in partnership with ASMARA INTERNATIONAL LIMITED, serving European markets.These enterprises highlight Indonesia’s strengths in quality control, flexible production, and export reliability, particularly for small and medium orders. Most are located in Java’s garment clusters, benefiting from established industrial infrastructure and skilled labor.Global Market DistributionIndonesia’s women’s trouser exports reached 14 countries in 2024, primarily destined for the United States, Japan, and Europe (notably Germany and France).Smaller consignments were shipped to Singapore, Malaysia, and Australia, supporting regional fashion retailers through ASEAN trade channels.This export model emphasizes adaptability—serving niche and private-label fashion brands that prefer multiple styles in smaller quantities rather than mass production.Indonesia’s flexible manufacturing model continues to distinguish it from competitors like China and Bangladesh, particularly in mid- to high-quality garment segments.Outlook for 2025Looking ahead, Indonesia’s women’s apparel exports are expected to remain stable or slightly increase as global retailers maintain demand for flexible, small-batch production.The rise of e-commerce brands and fast-response supply chains continues to benefit Indonesian manufacturers that can offer shorter lead times and customized orders.Challenges such as logistics costs and labor adjustments may persist, but innovation through automation, sustainable materials, and digital design is expected to strengthen Indonesia’s export competitiveness.Overall, 2025 is likely to bring continued resilience for Indonesia’s women’s pants sector, with stable trade performance and gradual value growth.Data SourceAll figures and corporate data are based on verified customs trade records analyzed by NBD DATA.For in-depth trade analytics, buyer–supplier mapping, and global apparel trend insights, please visit:https://en.nbd.ltd/service...

Offer

Fashion Retailers Drive Uruguay’s Sweater Import Market in 2025

2026-01-26 11:18:02

In 2025, Uruguay’s import market for knitted sweaters, pullovers, cardigans, and similar garments under HS Code 6110300010 demonstrated steady expansion, reaching a total import value of USD 24.47 million. These products—mainly described as SUETERES (JERSEYS), PULOVERES, CARDIGAN, and CHALECOS—reflect the growing appetite of Uruguayan consumers for warm, fashionable knitwear suited to both formal and casual occasions. According to data compiled by NBD DATA, 490 importers sourced from 44 countries, signaling a robust, diversified supply structure anchored in global fashion supply chains.Leading global retail groups such as ZARA, H&M, and Lolita S.A. played pivotal roles in shaping the import structure. Their operational scale, trend sensitivity, and efficient logistics channels helped Uruguay align with broader South American retail trends. The mid-price segment remained dominant, driven by fashion-conscious urban consumers seeking affordable yet stylish apparel.Monthly Trend OverviewMonthly data reveal clear seasonality in Uruguay’s sweater imports. Trade volume surged in February 2025, ahead of the autumn-winter retail season, with sustained inflows through the first half of the year and a moderate rise again toward December.Imports peaked in February, when shipments exceeded 465 tons, followed by a second-highest level in March. The period from May to September saw moderate import volumes as retailers transitioned between collections. By December, the total weight climbed again, preparing for the summer season and year-end retail promotions.Across 2025, Uruguay imported approximately 2,387 tons of sweaters and cardigans, reflecting stable supply and balanced demand throughout the year.Market Observation: Key Importers and Retail DynamicsUruguay’s knitwear imports were led by established retail chains closely tied to global apparel brands. The major importers included:LOJAS RENNER URUGUAY S.A. — Among the most active importers, managing 2,656 shipments valued at about USD 913 thousand.G.ZARA URUGUAY S.A. — The top importer by value (USD 2.16 million), focused on fast-fashion knitwear collections aligned with Inditex’s global product cycles.HENNES & MAURITZ URUGUAY S.A. — Imported USD 756 thousand worth of sweaters, emphasizing responsive sourcing and sustainability within its distribution model.LOLITA S A — A local fashion brand importing USD 1.39 million in knitwear for domestic retail expansion.UNILAM S A — Ranked among top importers with USD 2.69 million, maintaining consistent volume and diversified sourcing channels.Together, these companies accounted for a substantial share of total imports, highlighting Uruguay’s retail-oriented market structure. The integration of global logistics networks and digital inventory management has allowed these firms to synchronize stock levels with fast-changing consumer demand.Regional Trade FocusUruguay’s sweater imports in 2025 were mainly supplied by China, which continued to dominate the market due to its cost efficiency, product diversity, and speed of fulfillment. Bangladesh, Turkey, and Portugal followed as secondary sources, serving specific fashion and material niches such as wool blends and organic cotton lines.China’s sustained leadership underscores its adaptability to small and mid-sized Latin American markets, supplying both volume and design flexibility. Meanwhile, European exporters catered to higher-end retail and boutique segments, offering knitwear distinguished by quality craftsmanship and limited editions.Market Outlook for 2026The outlook for 2026 remains cautiously optimistic. Retail sales in Uruguay are projected to continue growing, supported by recovering household consumption and expanding e-commerce channels. The ongoing shift toward online and omnichannel models will further shape import patterns, emphasizing faster delivery and smaller, more frequent shipments.However, potential challenges include logistical costs and currency volatility, which could influence import pricing. Retailers are expected to respond by reinforcing partnerships with established suppliers in Asia and South America to maintain product flow and cost efficiency.Overall, the 2025 trade data reveal a resilient, fashion-driven market structure. Uruguay’s sweater imports will likely sustain steady growth, supported by consumer demand for accessible, quality knitwear and by the operational strength of leading global retailers.Data SourceAll trade statistics and company information are based on verified customs data processed and analyzed by NBD DATA.For enterprise-level access to detailed transaction records, supply chain maps, and long-term trend analytics, please visit:https://en.nbd.ltd/service...