Trade Dynamics of Plastic Cap Imports in the Philippines: Data, Regions, and Top Companies
In the first half of 2025, the Philippines’ imports of PLASTIC CAP (HS Code 39235000000) maintained a steady upward trajectory. According to NBD DATA, total import value reached USD 6.10 million with a total weight of 1,410 tons, spanning 1,413 trade transactions from January to June 2025. These plastic caps are widely used in beverage bottling, personal care, and industrial packaging, highlighting their essential role in the country’s manufacturing supply chain.
Monthly Import Trends
The Philippines demonstrated consistent import activity throughout the first half of 2025, with peaks in June and February. June registered the highest trade value at USD 1.36 million, accounting for more than one-fifth of the semester’s total. The February and May figures also reflected strong industrial demand, likely linked to beverage and consumer goods production cycles.
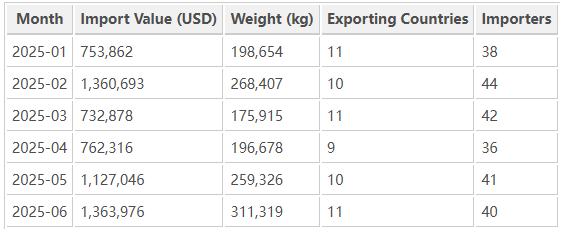
During the six-month period, 21 exporting countries supplied 124 Philippine importers, with 146 exporters participating in the trade network.
Key Importing Companies
A handful of major industrial and consumer goods manufacturers led the market for plastic cap imports:
COCA-COLA BEVERAGES PHILIPPINES INC.— The top importer, with trade worth USD 1.02 million and more than 307 tons of goods. Its suppliers include HON CHUAN (THAILAND) CO., LTD. and PACT GROUP CLOSURE SYSTEMS GUANGZHOU, forming a strong regional sourcing network.
UNILEVER PHILIPPINES INC. — Imported USD 961 thousand in plastic caps, mainly from PLASTEK INDUSTRIES INC. (U.S.) and JIANGMEN NEWLINE IMPORT & EXPORT CO., LTD. (China) for packaging personal care products.
PILIPINAS KYOHRITSU INC. — Brought in USD 565 thousand of imports, working closely with SUMITOMO WIRING SYSTEMS for automotive-related components.
EPL PROPACK PHILIPPINES INC. — Reported USD 284 thousand worth of imports from EPL PACKAGING (GUANGZHOU) and FOSHAN HUIHONG PLASTIC, both based in China.
CAJ PACKAGING SOLUTIONS INC. — Focused on pharmaceutical packaging, with imports of USD 112 thousand supplied by APTAR PHARMA INDIA PRIVATE LIMITED.
These companies together accounted for more than 65% of total import value, emphasizing the concentration of trade among leading multinationals with vertically integrated supply chains.
Major Exporting Partners
The Philippines sourced its plastic caps mainly from neighboring and industrialized countries, led by Thailand, China, the United States, and India.
HON CHUAN (THAILAND) CO., LTD.— The largest exporter to the Philippines, with transactions exceeding USD 924 thousand, supporting Coca-Cola’s regional production.
PLASTEK INDUSTRIES INC.— U.S.-based packaging manufacturer with shipments worth USD 927 thousand, mainly to Unilever Philippines.
EPL PACKAGING (GUANGZHOU) LIMITED — Supplied high-precision caps valued at USD 170 thousand to EPL Propack.
APTAR PHARMA INDIA PRIVATE LIMITED — Provided pharmaceutical-grade closures worth USD 112 thousand.
FOSHAN HUIHONG PLASTIC— Exported USD 113 thousand of cap materials for flexible packaging.
This highlights a regional triangle of trade among China, Thailand, and the Philippines, where short logistics distances and specialization in plastics manufacturing foster efficient supply flows.
Regional Trade Overview
Southeast Asia remained the Philippines’ primary import source for plastic caps, followed by East Asia and the United States. Thailand’s strong presence underscores its advanced packaging industry, while China’s growing role reflects cost advantages and expanding product diversity.
The structure demonstrates the Philippines’ reliance on regional sourcing resilience, balancing price efficiency and product quality through long-term supplier relationships.
Market Outlook
The import outlook for plastic caps in 2025 remains optimistic, driven by:
-
Strong beverage and consumer goods demand across the domestic market.
-
Expansion of local bottling and packaging facilities by global brands.
-
Deeper integration with regional suppliers in ASEAN and East Asia.
Potential risks include higher raw material prices, logistical uncertainties, and environmental pressures to adopt recyclable and biodegradable plastics. Nevertheless, industry players are expected to pursue supply diversification and sustainability initiatives to maintain competitiveness.
Detailed trade data and enterprise profiles are available from NBD DATA, providing professional insights into the global packaging and manufacturing supply chain.