Indonesia’s Cosmetic Export Momentum: Lotion Products Leading the Charge

Publishing Date:2026-01-05 11:50:07 Source: NBD Data(en.nbd.ltd)

Indonesia’s cosmetic industry has continued to show dynamic growth, with HS Code 33049930 — encompassing lotion products — emerging as one of the nation’s most internationally competitive categories.
According to NBD DATA, Indonesian lotion exports surged across 2024, with brands like KRIS Hand & Body Lotion and CITRA Hand Body Lotion Natural Glow UV representing the diverse range of skincare items being distributed globally. These products highlight Indonesia’s rising capacity to supply affordable yet high-quality personal care solutions to the global market.

I. Export Overview

In 2024, Indonesia’s lotion exports reached a total value of USD 14.77 million, with an export weight of approximately 6,933 tons. Throughout the year, there were 3,204 trade transactions involving 146 exporters and 388 importers, spanning 61 destination countries.
This wide distribution underscores Indonesia’s established position as a key skincare exporter within ASEAN and beyond, supported by efficient manufacturing, strong branding, and flexible trade routes.

Among the exported items, notable examples include:

  • “KRIS Hand & Body Lotion (100 ML X 72 PCS / Carton) – Fresh Hydration”

  • “CITRA Hand Body Lotion Natural Glow UV 4X6X210ML”

  • “NIVEA Body Lotion UV Extra Whitening 200MLX24”

These products exemplify Indonesia’s shift toward diversified, consumer-oriented skincare goods targeting both premium and mass-market segments.

II. Monthly Export Trends

Based on NBD DATA, Indonesia’s lotion exports remained stable throughout the year, with visible peaks in January, August, and December — driven by pre-holiday demand in Asia and the Middle East.

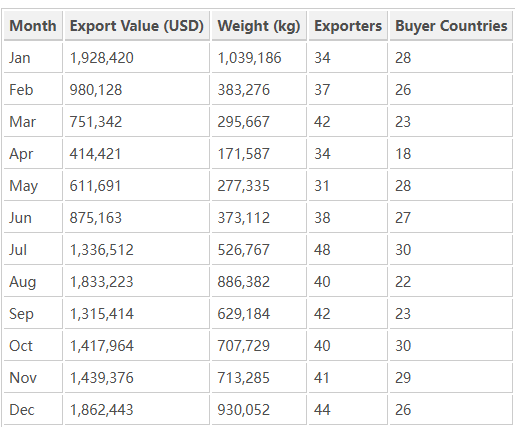
Exports peaked in December (USD 1.86 million), which aligns with global holiday sales. The lowest export period occurred in April, coinciding with Ramadan production slowdowns. The recovery in the second half of the year signals robust international demand for Indonesian lotion products, particularly in ASEAN and Middle Eastern markets.

III. Market Observation: Buyers and Suppliers

Top Global Buyers

According to verified NBD DATA, the largest buyers of Indonesian lotion products in 2024 included both multinational brands and regional distributors:

  1. L'OREAL (THAILAND) LIMITED – imported over 1,027 tons , mainly through its Indonesian subsidiary PT. YASULOR INDONESIA.

  2. VENUS BEAUTY PTE LTD. – a Singapore-based retail distributor sourcing from multiple Indonesian cosmetic producers.

  3. TEMPO SCAN PACIFIC PHILIPPINES INC. – part of the Tempo Scan Group, one of Southeast Asia’s major beauty product distributors.

  4. MODERN SY SDN BHD (1403898-V)– Malaysia-based wholesaler specializing in cosmetic imports.

  5. NURBB TRADING SDN BHD (1395809H) – a key intermediary for re-exporting Indonesian lotion products to Brunei and the Philippines.

These buyers account for the majority of regional trade flows, emphasizing ASEAN’s role as the largest consumer and distribution base for Indonesian skincare goods.

Leading Indonesian Exporters

The supplier side is characterized by both multinational manufacturing arms and independent exporters:

  1. PT. SPARINDO MUSTIKA – the top exporter,  serving partners across the Middle East and ASEAN.

  2. PT. YASULOR INDONESIA– a manufacturing subsidiary of L’Oréal Indonesia,  the Philippines, and Malaysia.

  3. PT. RAJA IMPEX – a major contract manufacturer and exporter focusing on private-label lotion production.

  4. PT. RUDY SOETADI– an experienced exporter serving regional personal care distributors.

  5. SENSATIA BOTANICALS– Bali-based natural skincare producer, exporting boutique batches to Japan, Singapore, and Europe.

Notably, these companies maintain diversified export portfolios, ranging from mass-market lotion products to niche organic formulations, ensuring resilience against global price fluctuations.

IV. Regional Trade Analysis

Indonesia’s lotion exports covered 61 countries, but the majority of shipments concentrated in Asia and the Middle East.
The top importing regions and their trade shares are as follows:

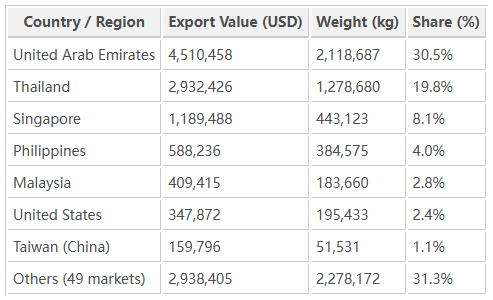
The United Arab Emirates has become Indonesia’s largest lotion import hub, often serving as a gateway for re-exports to Saudi Arabia and Africa.
Meanwhile, Thailand and Singapore remain dominant within ASEAN, importing both for local consumption and for redistribution through multinational supply chains.

Indonesia’s strong ties with these markets are reinforced by free trade agreements and proximity logistics advantages, allowing exporters to maintain competitive pricing while adhering to diverse regional cosmetic regulations.

V. Focus Country: China Market Outlook

Following the rules for export data, the focus country is China, where Indonesian lotion exports primarily cater to mid-tier retail channels and e-commerce importers.
Although China is not yet a top-five destination, demand for halal-certified and botanical-based skincare from Indonesia is increasing.
Products from PT. SPARINDO MUSTIKA and SENSATIA BOTANICALS are now visible in cross-border online marketplaces such as Tmall Global and Lazada CN.
This emerging channel indicates significant future potential for Indonesia’s lotion exports into the Chinese skincare segment, especially for natural and sustainable product lines.

VI. Industry Insights and Future Trends

  1. ASEAN Integration Strengthens Export Synergies
    Regional trade agreements and reduced tariffs under RCEP have simplified distribution for Indonesian cosmetic goods, encouraging cross-border brand collaborations within Southeast Asia.

  2. Halal and Eco-Certification Drive Market Access
    Over 60% of Indonesian lotion exports are now halal-certified, giving them a unique advantage in the Middle East and Muslim-majority markets. The increasing adoption of recyclable packaging also appeals to European importers.

  3. Brand Development and Digital Channels
    Exporters like SENSATIA BOTANICALS leverage digital storytelling and influencer marketing to expand brand visibility, while manufacturers such as PT. SPARINDO MUSTIKA invest in co-branding with overseas distributors.

  4. Rising Competition and Supply Chain Challenges
    Global skincare demand is expanding, but so is competition. Exporters face pressure from Vietnamese and Malaysian cosmetic producers. Rising palm oil prices — a key raw material — may affect production costs.

  5. Outlook for 2025
    With expected GDP growth and digital trade expansion, Indonesia’s lotion exports are forecast to grow by 10–12%, particularly through online retail and private-label manufacturing contracts.

VII. Conclusion

The lotion export segment showcases Indonesia’s evolving cosmetic export ecosystem — a blend of industrial scale, creativity, and regional integration.
From mass-market formulations by PT. YASULOR INDONESIA to organic brands like SENSATIA BOTANICALS, the sector demonstrates flexibility in meeting diverse global demands.
ASEAN and the Middle East remain the key growth anchors, while the emerging Chinese market offers fresh momentum for 2025 and beyond.
Indonesia’s continued investment in quality standards, sustainable packaging, and halal compliance ensures its position as a global skincare manufacturing hub.

VIII. Data Source

All data and company records are derived from NBD DATA, based on Indonesia’s 2024 export transactions of LOTION (HS Code 33049930).
Figures originate from verified customs declarations and NBD’s global trade intelligence platform, including transaction totals, partner countries, and verified exporter IDs.
For enterprise-level data access, shipment verification, or importer profiling, please visit NBD DATA Services.

Related Recommendations

Offer

Analyzing India’s Spring Imports in 2025: Trade Flows, Top Buyers, and Regional Insights

2026-01-26 14:22:52

Springs, categorized under HS code73209090, play a crucial role in India’s industrial manufacturing chain, covering sectors from automotive and heavy machinery to electronics and oilfield equipment. As 2025 progressed, India’s import data for SPRINGreflected both the country’s expanding industrial demand and its reliance on globally specialized suppliers. According to trade intelligence from NBD DATA, India’s imports of mechanical springs continued to demonstrate strong growth in both value and shipment frequency.Market OverviewIn 2025, India imported a total of 91,744 spring shipments, valued at USD 71.86 million, involving 3,000 importers, 5,334 exporters, and 71 trading countries. The imported volume reached nearly 957 million units, with an aggregate weight of about 1.03 million kg. This high level of trade activity underscores India’s strong industrial consumption capacity and the continued integration of its manufacturing sector into the global component supply network.Common imported product types included:Valve and compression springs for automotive and machinery applications.Retaining and locking springs used in control valves and industrial fittings.Air springs and torsion springs for suspension and vibration control.Precision coil and disc springs for electronic assemblies and energy equipment.Sample imports recorded in NBD’s dataset include:“VALVE SPRING V12K PART NO 7618835”, “AIR SPRING ASSY 24C7201”, and “SPARE PARTS FOR FILLING MACHINES COMPRESSION SPRING 2522235 0000”, reflecting diverse mechanical use cases.Monthly Import PerformanceThroughout 2025, India’s spring import activity showed steady momentum, with a moderate seasonal peak during the second and third quarters — aligning with fiscal restocking and industrial production cycles.The value trend indicates consistent import levels, with May to July representing the most active phase. This reflects India’s mid-year production surge in automotive and mechanical assembly sectors.Market Observation: Key Importers and SuppliersTop Indian Importers of Springs (HS 73209090)SCHAEFFLER INDIA LIMITED– USD 5.57 millionFIBRO INDIA PRECISION PRODUCTS PRIVATE LIMITED– USD 1.84 millionHYOSUNG T & D INDIA PRIVATE LIMITED– USD 0.84 millionLESER INDIA PVT LTD– USD 0.65 millionTETRA PAK INDIA PRIVATE LIMITED– USD 0.32 millionThese leading Indian companies reflect diverse end-use industries. Schaeffler India supplies precision components to automotive and industrial systems, while Fibro India and Hyosung T&D specialize in manufacturing automation and power equipment. The presence of Leser India and Tetra Pak India emphasizes the import of springs for valves, packaging machinery, and process equipment — critical for the food, beverage, and energy sectors.Top Global Suppliers to IndiaSTROMSHOLMEN AB(Sweden) – USD 1.83 millionDENSO CORPORATION(Japan) – USD 1.43 millionAISIN CORPORATION(Japan) – USD 0.47 millionLESER GMBH & CO KG(Germany) – USD 0.59 millionM S SPECIAL SPRINGS S R L(Italy) – USD 0.34 millionGlobal supply leadership remains with high-precision European and Japanese manufacturers, indicating that India’s import preference tilts toward technologically advanced products used in automotive systems, compressors, and industrial machinery.Regional Trade DistributionIndia’s imports of springs during 2025 were sourced from 71 countries, reflecting a wide-reaching supply chain.The top contributors by shipment and value were as follows:China leads by shipment count, primarily serving India’s demand for mid-tier and low-cost automotive and industrial springs. Germany and Japan, however, account for higher per-unit value due to advanced manufacturing standards. The United States maintains relevance in oilfield and aerospace-grade spring exports. Italy and Sweden supply high-end industrial springs used in hydraulic and process systems.This diversified structure ensures resilience in India’s import supply chain, minimizing dependency on any single source market.Regional Focus: Trade with ChinaIn India’s 2025 spring imports, China remained the most frequent trading partner. With over 21,000 shipments, Chinese manufacturers supplied a significant portion of standard mechanical and precision springs used in machinery, electronics, and vehicles. The price-performance ratio from Chinese suppliers continues to attract Indian SMEs, especially those in Tier 2 and Tier 3 manufacturing clusters such as Pune, Ahmedabad, and Coimbatore.However, India’s sustained trade with Germany, Japan, and the U.S. indicates a dual sourcing strategy: importing cost-efficient items from Asia and high-specification parts from Europe and North America.Industrial InterpretationThe 2025 data highlights India’s strong industrial rebound, reflected by the high import frequency of precision and heavy-duty springs. Several macro trends can be inferred:Manufacturing Expansion – Consistent monthly imports reveal growing demand in India’s automotive and machinery production sectors.Technological Upgrade – Imports from advanced economies suggest increasing adoption of high-performance mechanical components.Supply Chain Diversification – India sources from 70+ countries, mitigating risk amid shifting global logistics.Investment Correlation – Foreign Direct Investment (FDI) in manufacturing complements the steady inflow of critical mechanical components like springs.ConclusionIndia’s import performance under HS 73209090 illustrates a balanced combination of cost efficiency and technology-driven sourcing. The USD 71.86 million trade value for 2025 confirms the importance of springs in sustaining industrial productivity and assembly-line operations across sectors. With 5,334 exporters and 3,000 importers, the ecosystem reflects a competitive, globalized market environment.Going forward, India is expected to retain a strong import flow of springs to support its expanding automotive, energy, and manufacturing sectors. At the same time, localized production will likely rise under the “Make in India” initiative, gradually reducing dependency on imports for standardized components while maintaining imports for advanced technologies.Data SourceAll quantitative data and trade intelligence in this report are based on 2025 import records from NBD DATA, processed through its verified trade database.For deeper analytics or enterprise-level data services, please visit the NBD DATA Service Portal....

Offer

Indonesia’s Women’s Pants Exports Reached 100 Thousand USD in 2024

2026-01-26 11:39:43

In 2024, Indonesia exported women’s trousers and similar woven garments under HS Code 62046200, with a total export value of USD 100,320. These shipments—listed under WOMEN PANT in customs data—show Indonesia’s ongoing role as a key player in global apparel manufacturing, particularly for mid-range and specialized fashion orders.According to NBD DATA, exports reached 14 destination countries, involving 30 exporters and 18 importers. Despite the small trade value, the data highlight Indonesia’s flexibility in fulfilling diverse, small-batch production for international brands and private labels.Quarterly Export OverviewExports of women’s trousers from Indonesia in 2024 displayed a strong seasonal pattern, with peaks in Q1 and Q4, aligning with international production and fashion cycles.Q4 2024 was the most active period, accounting for 43% of total annual exports, as overseas retailers increased orders before the year-end fashion season.Meanwhile, Q3 saw stable shipments supporting autumn inventory cycles, while Q1 recorded early-year production deliveries to long-term clients in Asia and North America.Overall, Indonesia exported approximately 9,403 pieces of women’s pants throughout 2024, averaging USD 10.7 per piece.Key Exporters and Industrial InsightsIndonesia’s women’s pants exports were led by several internationally recognized garment manufacturers:PT. TAINAN ENTERPRISES INDONESIA – A subsidiary of Tainan Group, specializing in high-quality woven trousers for global retail brands, contributing significantly to Indonesia’s export base.PT ANDALAN MANDIRI BUSANA – A key player in tailored apparel, producing for mid-tier labels and private collections.PT. CITRA ABADI SEJATI – Exported garments for international names such as L.L. Bean, known for compliance with ethical and environmental standards.UNGARAN SARI GARMENTS – Focused on precision garment making and small-volume premium orders.SANDANG ASIA MAJU ABADI – Exported USD 98,671 worth of women’s pants in partnership with ASMARA INTERNATIONAL LIMITED, serving European markets.These enterprises highlight Indonesia’s strengths in quality control, flexible production, and export reliability, particularly for small and medium orders. Most are located in Java’s garment clusters, benefiting from established industrial infrastructure and skilled labor.Global Market DistributionIndonesia’s women’s trouser exports reached 14 countries in 2024, primarily destined for the United States, Japan, and Europe (notably Germany and France).Smaller consignments were shipped to Singapore, Malaysia, and Australia, supporting regional fashion retailers through ASEAN trade channels.This export model emphasizes adaptability—serving niche and private-label fashion brands that prefer multiple styles in smaller quantities rather than mass production.Indonesia’s flexible manufacturing model continues to distinguish it from competitors like China and Bangladesh, particularly in mid- to high-quality garment segments.Outlook for 2025Looking ahead, Indonesia’s women’s apparel exports are expected to remain stable or slightly increase as global retailers maintain demand for flexible, small-batch production.The rise of e-commerce brands and fast-response supply chains continues to benefit Indonesian manufacturers that can offer shorter lead times and customized orders.Challenges such as logistics costs and labor adjustments may persist, but innovation through automation, sustainable materials, and digital design is expected to strengthen Indonesia’s export competitiveness.Overall, 2025 is likely to bring continued resilience for Indonesia’s women’s pants sector, with stable trade performance and gradual value growth.Data SourceAll figures and corporate data are based on verified customs trade records analyzed by NBD DATA.For in-depth trade analytics, buyer–supplier mapping, and global apparel trend insights, please visit:https://en.nbd.ltd/service...

Offer

Fashion Retailers Drive Uruguay’s Sweater Import Market in 2025

2026-01-26 11:18:02

In 2025, Uruguay’s import market for knitted sweaters, pullovers, cardigans, and similar garments under HS Code 6110300010 demonstrated steady expansion, reaching a total import value of USD 24.47 million. These products—mainly described as SUETERES (JERSEYS), PULOVERES, CARDIGAN, and CHALECOS—reflect the growing appetite of Uruguayan consumers for warm, fashionable knitwear suited to both formal and casual occasions. According to data compiled by NBD DATA, 490 importers sourced from 44 countries, signaling a robust, diversified supply structure anchored in global fashion supply chains.Leading global retail groups such as ZARA, H&M, and Lolita S.A. played pivotal roles in shaping the import structure. Their operational scale, trend sensitivity, and efficient logistics channels helped Uruguay align with broader South American retail trends. The mid-price segment remained dominant, driven by fashion-conscious urban consumers seeking affordable yet stylish apparel.Monthly Trend OverviewMonthly data reveal clear seasonality in Uruguay’s sweater imports. Trade volume surged in February 2025, ahead of the autumn-winter retail season, with sustained inflows through the first half of the year and a moderate rise again toward December.Imports peaked in February, when shipments exceeded 465 tons, followed by a second-highest level in March. The period from May to September saw moderate import volumes as retailers transitioned between collections. By December, the total weight climbed again, preparing for the summer season and year-end retail promotions.Across 2025, Uruguay imported approximately 2,387 tons of sweaters and cardigans, reflecting stable supply and balanced demand throughout the year.Market Observation: Key Importers and Retail DynamicsUruguay’s knitwear imports were led by established retail chains closely tied to global apparel brands. The major importers included:LOJAS RENNER URUGUAY S.A. — Among the most active importers, managing 2,656 shipments valued at about USD 913 thousand.G.ZARA URUGUAY S.A. — The top importer by value (USD 2.16 million), focused on fast-fashion knitwear collections aligned with Inditex’s global product cycles.HENNES & MAURITZ URUGUAY S.A. — Imported USD 756 thousand worth of sweaters, emphasizing responsive sourcing and sustainability within its distribution model.LOLITA S A — A local fashion brand importing USD 1.39 million in knitwear for domestic retail expansion.UNILAM S A — Ranked among top importers with USD 2.69 million, maintaining consistent volume and diversified sourcing channels.Together, these companies accounted for a substantial share of total imports, highlighting Uruguay’s retail-oriented market structure. The integration of global logistics networks and digital inventory management has allowed these firms to synchronize stock levels with fast-changing consumer demand.Regional Trade FocusUruguay’s sweater imports in 2025 were mainly supplied by China, which continued to dominate the market due to its cost efficiency, product diversity, and speed of fulfillment. Bangladesh, Turkey, and Portugal followed as secondary sources, serving specific fashion and material niches such as wool blends and organic cotton lines.China’s sustained leadership underscores its adaptability to small and mid-sized Latin American markets, supplying both volume and design flexibility. Meanwhile, European exporters catered to higher-end retail and boutique segments, offering knitwear distinguished by quality craftsmanship and limited editions.Market Outlook for 2026The outlook for 2026 remains cautiously optimistic. Retail sales in Uruguay are projected to continue growing, supported by recovering household consumption and expanding e-commerce channels. The ongoing shift toward online and omnichannel models will further shape import patterns, emphasizing faster delivery and smaller, more frequent shipments.However, potential challenges include logistical costs and currency volatility, which could influence import pricing. Retailers are expected to respond by reinforcing partnerships with established suppliers in Asia and South America to maintain product flow and cost efficiency.Overall, the 2025 trade data reveal a resilient, fashion-driven market structure. Uruguay’s sweater imports will likely sustain steady growth, supported by consumer demand for accessible, quality knitwear and by the operational strength of leading global retailers.Data SourceAll trade statistics and company information are based on verified customs data processed and analyzed by NBD DATA.For enterprise-level access to detailed transaction records, supply chain maps, and long-term trend analytics, please visit:https://en.nbd.ltd/service...