Inside Colombia’s PVC Panel Market: Import Trends, Major Players, and Trade Regions (Jan–Jun 2025)

Publishing Date:2025-10-15 12:09:31 Source: NBD Data(en.nbd.ltd)

During the first half of 2025, Colombia’s import market for PVC panels (HS 3925900000) demonstrated a dynamic recovery and diversification pattern, reflecting the growing domestic demand for decorative and construction materials. According to data from NBD DATA, total import value reached USD 1,566,093, with a cumulative weight of 2.99 million kg across 103 batches. The trade involved 48 importers and 44 exporters, with China as the dominant supplier.

PVC panels—such as decorative wall boards, ceiling panels, and cladding components—are widely applied in interior finishing for residential and commercial buildings. Sample imports recorded under this HS code include plastic decorative sheets and PVC wall ceiling boards, typically used for low-cost renovation projects in Colombia’s housing and retail sectors.

Monthly Import Trends

Colombia’s PVC panel imports in the first half of 2025 displayed a distinct upward trajectory, particularly in May and June.

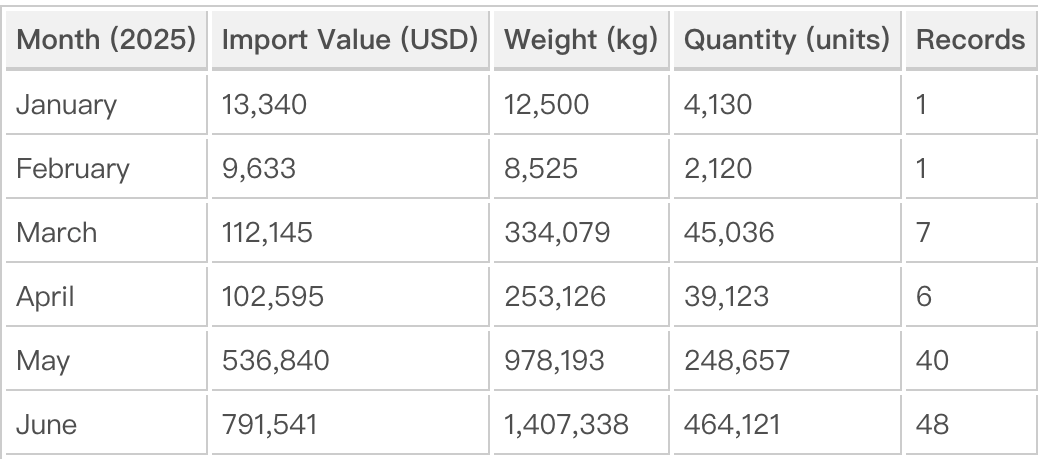
Imports began modestly in the early months, averaging below USD 15 k per month in January–February, before accelerating rapidly from March onward. The surge in May and June, totaling nearly USD 1.33 million, suggests a rebound in building materials demand and pre-stocking for upcoming construction projects in Colombia’s urban centers such as Bogotá and Medellín.

Market Observation: Importers and Suppliers

The PVC panel trade between China and Colombia is characterized by long-standing partnerships between Chinese manufacturers and Colombian importers specializing in decorative products. Among 48 importers, a few stand out for their consistent trade records and high shipment volumes.

Leading Importers

  1. TERRENOS PR SAS — the largest importer, accounting for USD 292,788 and 566,319 kg of imports. The company sourced primarily from Haining Wannaisi Decoration Material Co., Ltd. and several other Zhejiang-based suppliers.

  2. HOMEGA Colombia S.A.S. — imported 295,144 kg, valued at USD 81,914, cooperating mainly with Zhejiang Jinfeng New Material Co., Ltd..

  3. ANTIA LAB SAS — purchased 143,046 kg worth USD 32,904, mostly from Haining Chaodi Plastic Co., Ltd. and Ruoze Plastic Products Co., Ltd.

  4. INVERSIONES Y ADQUISICIONES G&T SAS — focused on specialty decorative panels, totaling USD 56,371.

  5. DISART ENTRETENIMIENTO CREATIVO SAS — imported USD 52,129 worth of PVC materials, indicating diversification toward event and retail decoration applications.

Major Suppliers

Chinese companies dominate Colombia’s PVC panel supply chain, accounting for over 96% of total imports. The following are the key exporters serving the Colombian market:

  1. Haining Wannaisi Decoration Material Co., Ltd. — Colombia’s top supplier, exporting USD 237,268 (453,730 kg).

  2. Haining Yayuanshi Plastic Ind Co., Ltd. — shipped 224,258 kg valued at USD 136,139, serving multiple buyers.

  3. Haining Ruoze Plastic Products Co., Ltd. — exported USD 58,242, mainly to ANTIA LAB SAS and TERRENOS PR SAS.

  4. Haining Zhuangheng Plastic Ind. Co., Ltd. — supplied USD 59,272 worth of panels.

  5. Hangzhou Twyford Import & Export Co., Ltd. — exported USD 98,721 in high-quality PVC profiles to Colombian distributors.

The trade matrix indicates a dense network connecting Zhejiang’s manufacturing hubs with Colombian importers, often through repeat, small-to-medium batch shipments. This pattern suggests strong business relationships and stable product demand rather than speculative trading.

Trade Regions and Partner Countries

Regional Composition

Colombia’s PVC panel imports are overwhelmingly sourced from Asia, particularly China. The country breakdown for Jan–Jun 2025 is as follows:

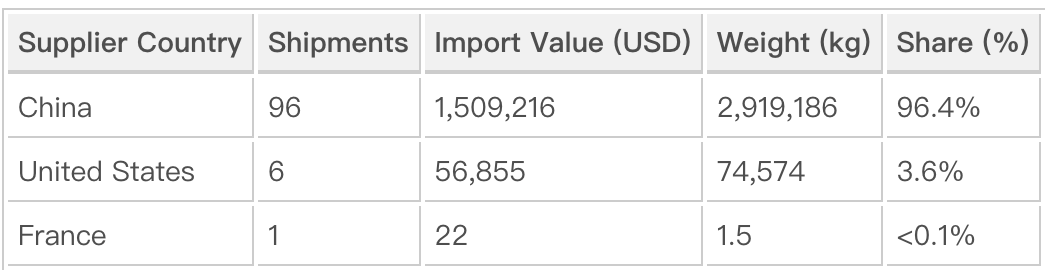
China’s dominance reflects its mature PVC extrusion industry and cost advantages in decorative plastics. The U.S. share, though minor, often includes specialty products or re-exported materials. France’s minimal record likely represents a sample or test shipment.

Focus Country Spotlight — China

Given China’s near-total share in Colombia’s PVC panel imports, it remains the focal point for trade relations. Chinese suppliers such as Haining Wannaisi, Ruoze Plastic, and Yayuanshi Plastic collectively handled the majority of Colombia’s import volume. Their competitive edge lies in mass production efficiency, diversified product lines (including printed, laminated, and fire-resistant panels), and flexible shipping options through Ningbo and Shanghai ports.

On the demand side, Colombian importers exhibit a preference for ready-to-install decorative panels, emphasizing moisture resistance and affordability for retail expansion and residential remodeling projects.

Market Insights

  1. Construction Sector Recovery: The Colombian housing and commercial renovation market rebounded during early 2025, driven by urban infrastructure projects and private housing refurbishments.

  2. China–Colombia Supply Chain Stability: The consistency of top exporters and importers indicates stable bilateral trade channels and growing supplier trust.

  3. Import Concentration: The top 5 importers accounted for roughly 65% of total import value, reflecting a semi-concentrated market where long-term partnerships determine pricing and logistics efficiency.

  4. Sustainable Growth Outlook: PVC panels continue to gain traction as an affordable, low-maintenance alternative to wood and ceramic materials, particularly in cost-sensitive segments.

Summary

In summary, Colombia’s PVC panel import market in the first half of 2025 was shaped by strong Chinese dominance, steady expansion in trade volumes, and the continued alignment of importers with established Asian suppliers. The steady increase from March to June underscores the resumption of construction and renovation activities, positioning PVC panels as a leading product in Colombia’s building materials import structure. Looking ahead, diversification into eco-friendly PVC alternatives and localized distribution networks may become key themes for the remainder of the year.

Data Source

This report is based on verified customs and trade records provided by NBD DATA, covering the period January 1 – June 30, 2025 for HS 3925900000 (PVC panel) under the Colombia Import dataset (code 201).
The dataset includes aggregated trade statistics, monthly transaction details, and verified importer–exporter linkages. For access to full datasets, professional dashboards, and company-level trade profiles, please visit NBD DATA Service.

Related Recommendations

Offer

Analyzing India’s Spring Imports in 2025: Trade Flows, Top Buyers, and Regional Insights

2026-01-26 14:22:52

Springs, categorized under HS code73209090, play a crucial role in India’s industrial manufacturing chain, covering sectors from automotive and heavy machinery to electronics and oilfield equipment. As 2025 progressed, India’s import data for SPRINGreflected both the country’s expanding industrial demand and its reliance on globally specialized suppliers. According to trade intelligence from NBD DATA, India’s imports of mechanical springs continued to demonstrate strong growth in both value and shipment frequency.Market OverviewIn 2025, India imported a total of 91,744 spring shipments, valued at USD 71.86 million, involving 3,000 importers, 5,334 exporters, and 71 trading countries. The imported volume reached nearly 957 million units, with an aggregate weight of about 1.03 million kg. This high level of trade activity underscores India’s strong industrial consumption capacity and the continued integration of its manufacturing sector into the global component supply network.Common imported product types included:Valve and compression springs for automotive and machinery applications.Retaining and locking springs used in control valves and industrial fittings.Air springs and torsion springs for suspension and vibration control.Precision coil and disc springs for electronic assemblies and energy equipment.Sample imports recorded in NBD’s dataset include:“VALVE SPRING V12K PART NO 7618835”, “AIR SPRING ASSY 24C7201”, and “SPARE PARTS FOR FILLING MACHINES COMPRESSION SPRING 2522235 0000”, reflecting diverse mechanical use cases.Monthly Import PerformanceThroughout 2025, India’s spring import activity showed steady momentum, with a moderate seasonal peak during the second and third quarters — aligning with fiscal restocking and industrial production cycles.The value trend indicates consistent import levels, with May to July representing the most active phase. This reflects India’s mid-year production surge in automotive and mechanical assembly sectors.Market Observation: Key Importers and SuppliersTop Indian Importers of Springs (HS 73209090)SCHAEFFLER INDIA LIMITED– USD 5.57 millionFIBRO INDIA PRECISION PRODUCTS PRIVATE LIMITED– USD 1.84 millionHYOSUNG T & D INDIA PRIVATE LIMITED– USD 0.84 millionLESER INDIA PVT LTD– USD 0.65 millionTETRA PAK INDIA PRIVATE LIMITED– USD 0.32 millionThese leading Indian companies reflect diverse end-use industries. Schaeffler India supplies precision components to automotive and industrial systems, while Fibro India and Hyosung T&D specialize in manufacturing automation and power equipment. The presence of Leser India and Tetra Pak India emphasizes the import of springs for valves, packaging machinery, and process equipment — critical for the food, beverage, and energy sectors.Top Global Suppliers to IndiaSTROMSHOLMEN AB(Sweden) – USD 1.83 millionDENSO CORPORATION(Japan) – USD 1.43 millionAISIN CORPORATION(Japan) – USD 0.47 millionLESER GMBH & CO KG(Germany) – USD 0.59 millionM S SPECIAL SPRINGS S R L(Italy) – USD 0.34 millionGlobal supply leadership remains with high-precision European and Japanese manufacturers, indicating that India’s import preference tilts toward technologically advanced products used in automotive systems, compressors, and industrial machinery.Regional Trade DistributionIndia’s imports of springs during 2025 were sourced from 71 countries, reflecting a wide-reaching supply chain.The top contributors by shipment and value were as follows:China leads by shipment count, primarily serving India’s demand for mid-tier and low-cost automotive and industrial springs. Germany and Japan, however, account for higher per-unit value due to advanced manufacturing standards. The United States maintains relevance in oilfield and aerospace-grade spring exports. Italy and Sweden supply high-end industrial springs used in hydraulic and process systems.This diversified structure ensures resilience in India’s import supply chain, minimizing dependency on any single source market.Regional Focus: Trade with ChinaIn India’s 2025 spring imports, China remained the most frequent trading partner. With over 21,000 shipments, Chinese manufacturers supplied a significant portion of standard mechanical and precision springs used in machinery, electronics, and vehicles. The price-performance ratio from Chinese suppliers continues to attract Indian SMEs, especially those in Tier 2 and Tier 3 manufacturing clusters such as Pune, Ahmedabad, and Coimbatore.However, India’s sustained trade with Germany, Japan, and the U.S. indicates a dual sourcing strategy: importing cost-efficient items from Asia and high-specification parts from Europe and North America.Industrial InterpretationThe 2025 data highlights India’s strong industrial rebound, reflected by the high import frequency of precision and heavy-duty springs. Several macro trends can be inferred:Manufacturing Expansion – Consistent monthly imports reveal growing demand in India’s automotive and machinery production sectors.Technological Upgrade – Imports from advanced economies suggest increasing adoption of high-performance mechanical components.Supply Chain Diversification – India sources from 70+ countries, mitigating risk amid shifting global logistics.Investment Correlation – Foreign Direct Investment (FDI) in manufacturing complements the steady inflow of critical mechanical components like springs.ConclusionIndia’s import performance under HS 73209090 illustrates a balanced combination of cost efficiency and technology-driven sourcing. The USD 71.86 million trade value for 2025 confirms the importance of springs in sustaining industrial productivity and assembly-line operations across sectors. With 5,334 exporters and 3,000 importers, the ecosystem reflects a competitive, globalized market environment.Going forward, India is expected to retain a strong import flow of springs to support its expanding automotive, energy, and manufacturing sectors. At the same time, localized production will likely rise under the “Make in India” initiative, gradually reducing dependency on imports for standardized components while maintaining imports for advanced technologies.Data SourceAll quantitative data and trade intelligence in this report are based on 2025 import records from NBD DATA, processed through its verified trade database.For deeper analytics or enterprise-level data services, please visit the NBD DATA Service Portal....

Offer

Indonesia’s Women’s Pants Exports Reached 100 Thousand USD in 2024

2026-01-26 11:39:43

In 2024, Indonesia exported women’s trousers and similar woven garments under HS Code 62046200, with a total export value of USD 100,320. These shipments—listed under WOMEN PANT in customs data—show Indonesia’s ongoing role as a key player in global apparel manufacturing, particularly for mid-range and specialized fashion orders.According to NBD DATA, exports reached 14 destination countries, involving 30 exporters and 18 importers. Despite the small trade value, the data highlight Indonesia’s flexibility in fulfilling diverse, small-batch production for international brands and private labels.Quarterly Export OverviewExports of women’s trousers from Indonesia in 2024 displayed a strong seasonal pattern, with peaks in Q1 and Q4, aligning with international production and fashion cycles.Q4 2024 was the most active period, accounting for 43% of total annual exports, as overseas retailers increased orders before the year-end fashion season.Meanwhile, Q3 saw stable shipments supporting autumn inventory cycles, while Q1 recorded early-year production deliveries to long-term clients in Asia and North America.Overall, Indonesia exported approximately 9,403 pieces of women’s pants throughout 2024, averaging USD 10.7 per piece.Key Exporters and Industrial InsightsIndonesia’s women’s pants exports were led by several internationally recognized garment manufacturers:PT. TAINAN ENTERPRISES INDONESIA – A subsidiary of Tainan Group, specializing in high-quality woven trousers for global retail brands, contributing significantly to Indonesia’s export base.PT ANDALAN MANDIRI BUSANA – A key player in tailored apparel, producing for mid-tier labels and private collections.PT. CITRA ABADI SEJATI – Exported garments for international names such as L.L. Bean, known for compliance with ethical and environmental standards.UNGARAN SARI GARMENTS – Focused on precision garment making and small-volume premium orders.SANDANG ASIA MAJU ABADI – Exported USD 98,671 worth of women’s pants in partnership with ASMARA INTERNATIONAL LIMITED, serving European markets.These enterprises highlight Indonesia’s strengths in quality control, flexible production, and export reliability, particularly for small and medium orders. Most are located in Java’s garment clusters, benefiting from established industrial infrastructure and skilled labor.Global Market DistributionIndonesia’s women’s trouser exports reached 14 countries in 2024, primarily destined for the United States, Japan, and Europe (notably Germany and France).Smaller consignments were shipped to Singapore, Malaysia, and Australia, supporting regional fashion retailers through ASEAN trade channels.This export model emphasizes adaptability—serving niche and private-label fashion brands that prefer multiple styles in smaller quantities rather than mass production.Indonesia’s flexible manufacturing model continues to distinguish it from competitors like China and Bangladesh, particularly in mid- to high-quality garment segments.Outlook for 2025Looking ahead, Indonesia’s women’s apparel exports are expected to remain stable or slightly increase as global retailers maintain demand for flexible, small-batch production.The rise of e-commerce brands and fast-response supply chains continues to benefit Indonesian manufacturers that can offer shorter lead times and customized orders.Challenges such as logistics costs and labor adjustments may persist, but innovation through automation, sustainable materials, and digital design is expected to strengthen Indonesia’s export competitiveness.Overall, 2025 is likely to bring continued resilience for Indonesia’s women’s pants sector, with stable trade performance and gradual value growth.Data SourceAll figures and corporate data are based on verified customs trade records analyzed by NBD DATA.For in-depth trade analytics, buyer–supplier mapping, and global apparel trend insights, please visit:https://en.nbd.ltd/service...

Offer

Fashion Retailers Drive Uruguay’s Sweater Import Market in 2025

2026-01-26 11:18:02

In 2025, Uruguay’s import market for knitted sweaters, pullovers, cardigans, and similar garments under HS Code 6110300010 demonstrated steady expansion, reaching a total import value of USD 24.47 million. These products—mainly described as SUETERES (JERSEYS), PULOVERES, CARDIGAN, and CHALECOS—reflect the growing appetite of Uruguayan consumers for warm, fashionable knitwear suited to both formal and casual occasions. According to data compiled by NBD DATA, 490 importers sourced from 44 countries, signaling a robust, diversified supply structure anchored in global fashion supply chains.Leading global retail groups such as ZARA, H&M, and Lolita S.A. played pivotal roles in shaping the import structure. Their operational scale, trend sensitivity, and efficient logistics channels helped Uruguay align with broader South American retail trends. The mid-price segment remained dominant, driven by fashion-conscious urban consumers seeking affordable yet stylish apparel.Monthly Trend OverviewMonthly data reveal clear seasonality in Uruguay’s sweater imports. Trade volume surged in February 2025, ahead of the autumn-winter retail season, with sustained inflows through the first half of the year and a moderate rise again toward December.Imports peaked in February, when shipments exceeded 465 tons, followed by a second-highest level in March. The period from May to September saw moderate import volumes as retailers transitioned between collections. By December, the total weight climbed again, preparing for the summer season and year-end retail promotions.Across 2025, Uruguay imported approximately 2,387 tons of sweaters and cardigans, reflecting stable supply and balanced demand throughout the year.Market Observation: Key Importers and Retail DynamicsUruguay’s knitwear imports were led by established retail chains closely tied to global apparel brands. The major importers included:LOJAS RENNER URUGUAY S.A. — Among the most active importers, managing 2,656 shipments valued at about USD 913 thousand.G.ZARA URUGUAY S.A. — The top importer by value (USD 2.16 million), focused on fast-fashion knitwear collections aligned with Inditex’s global product cycles.HENNES & MAURITZ URUGUAY S.A. — Imported USD 756 thousand worth of sweaters, emphasizing responsive sourcing and sustainability within its distribution model.LOLITA S A — A local fashion brand importing USD 1.39 million in knitwear for domestic retail expansion.UNILAM S A — Ranked among top importers with USD 2.69 million, maintaining consistent volume and diversified sourcing channels.Together, these companies accounted for a substantial share of total imports, highlighting Uruguay’s retail-oriented market structure. The integration of global logistics networks and digital inventory management has allowed these firms to synchronize stock levels with fast-changing consumer demand.Regional Trade FocusUruguay’s sweater imports in 2025 were mainly supplied by China, which continued to dominate the market due to its cost efficiency, product diversity, and speed of fulfillment. Bangladesh, Turkey, and Portugal followed as secondary sources, serving specific fashion and material niches such as wool blends and organic cotton lines.China’s sustained leadership underscores its adaptability to small and mid-sized Latin American markets, supplying both volume and design flexibility. Meanwhile, European exporters catered to higher-end retail and boutique segments, offering knitwear distinguished by quality craftsmanship and limited editions.Market Outlook for 2026The outlook for 2026 remains cautiously optimistic. Retail sales in Uruguay are projected to continue growing, supported by recovering household consumption and expanding e-commerce channels. The ongoing shift toward online and omnichannel models will further shape import patterns, emphasizing faster delivery and smaller, more frequent shipments.However, potential challenges include logistical costs and currency volatility, which could influence import pricing. Retailers are expected to respond by reinforcing partnerships with established suppliers in Asia and South America to maintain product flow and cost efficiency.Overall, the 2025 trade data reveal a resilient, fashion-driven market structure. Uruguay’s sweater imports will likely sustain steady growth, supported by consumer demand for accessible, quality knitwear and by the operational strength of leading global retailers.Data SourceAll trade statistics and company information are based on verified customs data processed and analyzed by NBD DATA.For enterprise-level access to detailed transaction records, supply chain maps, and long-term trend analytics, please visit:https://en.nbd.ltd/service...