Indonesia’s Fresh Mangosteen Exports Exceed USD 16.35 Million in Late 2024

Publishing Date:2025-11-18 14:31:25 Source: NBD Data(en.nbd.ltd)

Indonesia consolidated its global leadership in the tropical fruit trade during the second half of 2024, as fresh mangosteen (HS 08045030) exports reached a total value of USD 16.36 million.
According to NBD DATA, between June and December 2024, Indonesian exporters shipped over 5.36 million units of fresh mangosteen to ten destination countries, in 831 export transactions.

The remarkable performance underscores Indonesia’s growing dominance in premium tropical fruit markets across Asia and beyond.

Export Overview

Between June 30 and December 31, 2024, Indonesia’s fresh mangosteen exports recorded strong and consistent growth.
The trade flow involved 47 exporters and 50 international buyers, reflecting an increasingly diversified global supply chain.

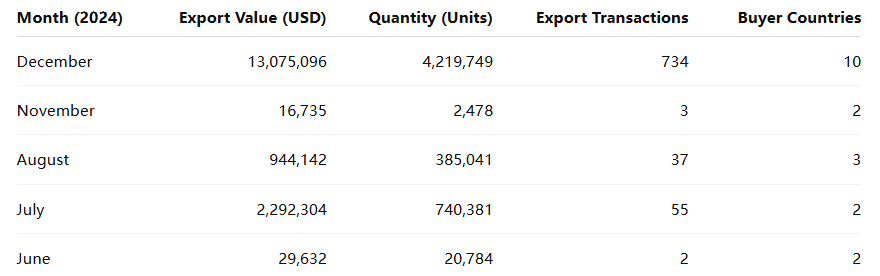
The export surge peaked in December 2024, when mangosteen shipments accounted for roughly 80% of total half-year export value, confirming Indonesia’s ability to align production cycles with international demand periods—particularly the East Asian winter season.

Key Importing Markets

During the reporting period, Indonesian mangosteens reached ten countries, with the People’s Republic of China standing out as the largest buyer, followed by Singapore, Malaysia, and Vietnam.
These countries collectively accounted for more than 95% of total export value.

Market Highlights

  • China: The leading destination, driven by premium retail demand in major cities such as Shanghai, Guangzhou, and Beijing.

  • Singapore: A strategic re-export and testing hub for ASEAN fruit logistics.

  • Malaysia & Vietnam: Stable regional buyers, maintaining year-round demand for mangosteen as a luxury fruit.

  • United Arab Emirates: Emerging as a small but steady market via re-export channels to the Middle East.

The dominance of Asian markets reflects Indonesia’s logistical advantage and the freshness requirement of mangosteen exports, which favor short transit times and efficient cold-chain handling.

Top Buyers

Trade data from NBD DATA identify China-based importers as the principal partners for Indonesian exporters.
The top buyers by trade value include:

  1. BEIJING JUNYAO INTERNATIONAL — USD 5,605,777

  2. BEIJING JUNHUI INTERNATIONAL TRADING CO., LTD. — USD 2,765,971

  3. SHANGHAI SUNSHINE AGRICULTURE TECHNOLOGY CO., LTD. — USD 1,048,746

  4. CHUANNONGJING (HAINAN) INTERNATIONAL TRADE CO., LTD. — USD 388,773

  5. CHUN WAN YI (GUANGZHOU) SUPPLY CHAIN MANAGEMENT CO., LTD. — USD 594,194

Together, these companies accounted for nearly 65% of Indonesia’s total mangosteen export value, highlighting the strong dependence on Chinese wholesale and retail markets.
Chinese buyers often act as import distributors, channeling fresh mangosteen to multiple provinces for online and offline fruit markets.

Leading Indonesian Exporters

Indonesia’s export structure is characterized by a vibrant mix of large-scale agricultural firms and smaller fruit consolidators.
Top exporters include:

  1. PT. ANUGERAH UTAMA PUSPA INDONESIA — active in multiple buyer partnerships

  2. PT. BUMI INDO NUSANTARA ABADI — large-volume supplier to Shanghai and Beijing

  3. PT. GHF AGRO MANDIRI — high consistency in delivery and quality

  4. CV. PUTRI CIKAL MUSTIKA SEJATI — specialized in export packaging

  5. PT. MAHKOTA MANGGIS SEHATI — emerging mid-sized exporter

These companies together managed a significant share of the December export boom, with PT. BUMI INDO NUSANTARA ABADI alone handling over 300,000 units in that month.

Seasonal and Production Factors

Indonesia’s mangosteen production follows a distinct seasonal cycle, with peak harvests occurring between October and February.
This natural timing aligns perfectly with export demand from northern Asia, where tropical fruit consumption rises during the winter months.

Key Production Areas

  • West Java (Tasikmalaya, Subang, Purwakarta): Known for premium-grade mangosteen with uniform size and high sweetness.

  • Bali & Lombok: Supply niche export varieties with superior aesthetic quality.

  • Sumatra (Lampung & North Sumatra): Emerging production zones with growing export capacity.

Improved post-harvest handling and cold-chain infrastructure—supported by Indonesia’s Ministry of Agriculture—have been crucial to maintaining fruit quality during long-distance shipments.

Export Supply Chain and Logistics

The mangosteen export process typically involves multiple specialized stages:

  1. Collection and Sorting: Exporters consolidate fruit from local cooperatives and farmers, grading by size and color.

  2. Packaging: Use of ventilated cartons or mesh bags designed to prevent bruising and heat accumulation.

  3. Pre-cooling and Quality Control: Warehouses near Jakarta and Surabaya serve as key pre-export centers.

  4. Air Freight: Given the fruit’s sensitivity, most high-value shipments are exported via air, especially to China and Singapore.

This cold-chain discipline enables Indonesia to deliver mangosteens at peak freshness—often reaching retail shelves in under 48 hours after harvest.

Price and Value Trends

The average unit export price for Indonesian mangosteen during H2 2024 was approximately USD 3.05 per kilogram equivalent, with noticeable variation across markets.

  • China: Premium-grade fruits achieved up to USD 3.40/kg.

  • Singapore: Averaged around USD 2.90/kg, reflecting its re-export function.

  • Malaysia and Vietnam: Generally lower, around USD 2.50/kg, for bulk shipments.

This pricing range reflects strong international positioning of Indonesian mangosteen as a mid- to high-value tropical fruit, competing favorably with Thai and Vietnamese exports.

Competitive Landscape

Indonesia’s rapid growth in mangosteen exports is reshaping regional competition:

  • Thailand, traditionally the world’s leading exporter, faced temporary declines in late 2024 due to adverse weather.

  • Vietnam maintained steady export volumes but with smaller fruit size and limited premium-grade supply.

  • Malaysia focused mainly on domestic consumption, leaving export markets largely to Indonesia and Thailand.

Indonesia’s ability to offer consistent quality, rapid logistics, and competitive prices has earned it preferred-supplier status in Chinese and Singaporean wholesale markets.

Trade Relationship Dynamics

The export data reveal recurring partnerships between specific Indonesian exporters and Chinese buyers, suggesting stable long-term contracts.
For example:

Such relationships underline the strategic maturity of Indonesia’s fruit export sector, which increasingly operates on contractual and branded supply chains rather than sporadic spot trading.

Regional Economic Impact

The surge in mangosteen exports has yielded tangible benefits for Indonesia’s local economies:

  • Farm-level earnings: Farmers in Java and Bali reported improved incomes from direct export-grade purchases.

  • Employment growth: Sorting, packaging, and quality control facilities expanded their seasonal workforce.

  • SME participation: More small- and medium-sized enterprises entered the export supply chain through subcontracting.

In addition, government-supported programs for fruit traceability and Good Agricultural Practices (GAP) certification have enhanced international confidence in Indonesian produce.

Challenges and Quality Standards

Despite the strong export performance, several operational challenges persist:

  1. Pest and phytosanitary compliance: Exporters must meet stringent requirements for pesticide residue and pest control, especially for China and Japan.

  2. Cold-chain limitations: Some secondary production regions lack consistent refrigeration infrastructure.

  3. Market concentration: Heavy dependence on China increases vulnerability to demand shifts or import restrictions.

To mitigate these issues, exporters are investing in packhouse upgrades, traceability systems, and partnerships with logistics providers to maintain export readiness throughout the season.

Sustainability and Future Potential

The expansion of mangosteen exports also raises questions about long-term sustainability.
Government agencies and private associations are now emphasizing eco-friendly cultivation, reduced pesticide use, and training programs for farmers to ensure the sector’s continued growth.

The Ministry of Agriculture’s 2025 agenda includes:

  • Developing certified organic mangosteen clusters.

  • Expanding export access to Japan and South Korea.

  • Promoting geographical indication labeling for premium mangosteen from specific regions like Subang or Tasikmalaya.

These initiatives aim to sustain Indonesia’s export growth while positioning mangosteen as a signature tropical fruit with global brand recognition.

Outlook for 2025

The export outlook for 2025 remains highly positive. Key projections include:

  • Increased export value expected to surpass USD 20 million if favorable weather and logistics persist.

  • Expanded air-cargo capacity to China and Singapore during peak harvest months.

  • Higher adoption of quality certification to meet Japan and South Korea’s import standards.

With a growing base of experienced exporters and strong demand from Asian markets, Indonesia’s fresh mangosteen industry is poised to strengthen its global presence.

Conclusion

Indonesia’s export performance for fresh mangosteen (HS 08045030) during June–December 2024 illustrates the country’s ascent as a tropical fruit powerhouse.
With exports surpassing USD 16.35 million and over 5.36 million units shipped, Indonesia confirmed its role as one of Asia’s premier suppliers of premium mangosteen.

Strong partnerships with Chinese importers, improved logistics, and expanding smallholder participation have positioned the country for continued success in 2025 and beyond.
As global consumers increasingly value freshness and quality, Indonesia’s mangosteen industry is set to remain at the forefront of the international tropical fruit trade.

Data Source

All figures in this article are derived from verified trade statistics by NBD DATA, covering Indonesia’s exports of HS 08045030 (Fresh Mangosteen) from June 30 to December 31, 2024.
For tailored export intelligence and market analysis, please visit NBD DATA Services.

Related Recommendations

Offer

Analyzing India’s Spring Imports in 2025: Trade Flows, Top Buyers, and Regional Insights

2026-01-26 14:22:52

Springs, categorized under HS code73209090, play a crucial role in India’s industrial manufacturing chain, covering sectors from automotive and heavy machinery to electronics and oilfield equipment. As 2025 progressed, India’s import data for SPRINGreflected both the country’s expanding industrial demand and its reliance on globally specialized suppliers. According to trade intelligence from NBD DATA, India’s imports of mechanical springs continued to demonstrate strong growth in both value and shipment frequency.Market OverviewIn 2025, India imported a total of 91,744 spring shipments, valued at USD 71.86 million, involving 3,000 importers, 5,334 exporters, and 71 trading countries. The imported volume reached nearly 957 million units, with an aggregate weight of about 1.03 million kg. This high level of trade activity underscores India’s strong industrial consumption capacity and the continued integration of its manufacturing sector into the global component supply network.Common imported product types included:Valve and compression springs for automotive and machinery applications.Retaining and locking springs used in control valves and industrial fittings.Air springs and torsion springs for suspension and vibration control.Precision coil and disc springs for electronic assemblies and energy equipment.Sample imports recorded in NBD’s dataset include:“VALVE SPRING V12K PART NO 7618835”, “AIR SPRING ASSY 24C7201”, and “SPARE PARTS FOR FILLING MACHINES COMPRESSION SPRING 2522235 0000”, reflecting diverse mechanical use cases.Monthly Import PerformanceThroughout 2025, India’s spring import activity showed steady momentum, with a moderate seasonal peak during the second and third quarters — aligning with fiscal restocking and industrial production cycles.The value trend indicates consistent import levels, with May to July representing the most active phase. This reflects India’s mid-year production surge in automotive and mechanical assembly sectors.Market Observation: Key Importers and SuppliersTop Indian Importers of Springs (HS 73209090)SCHAEFFLER INDIA LIMITED– USD 5.57 millionFIBRO INDIA PRECISION PRODUCTS PRIVATE LIMITED– USD 1.84 millionHYOSUNG T & D INDIA PRIVATE LIMITED– USD 0.84 millionLESER INDIA PVT LTD– USD 0.65 millionTETRA PAK INDIA PRIVATE LIMITED– USD 0.32 millionThese leading Indian companies reflect diverse end-use industries. Schaeffler India supplies precision components to automotive and industrial systems, while Fibro India and Hyosung T&D specialize in manufacturing automation and power equipment. The presence of Leser India and Tetra Pak India emphasizes the import of springs for valves, packaging machinery, and process equipment — critical for the food, beverage, and energy sectors.Top Global Suppliers to IndiaSTROMSHOLMEN AB(Sweden) – USD 1.83 millionDENSO CORPORATION(Japan) – USD 1.43 millionAISIN CORPORATION(Japan) – USD 0.47 millionLESER GMBH & CO KG(Germany) – USD 0.59 millionM S SPECIAL SPRINGS S R L(Italy) – USD 0.34 millionGlobal supply leadership remains with high-precision European and Japanese manufacturers, indicating that India’s import preference tilts toward technologically advanced products used in automotive systems, compressors, and industrial machinery.Regional Trade DistributionIndia’s imports of springs during 2025 were sourced from 71 countries, reflecting a wide-reaching supply chain.The top contributors by shipment and value were as follows:China leads by shipment count, primarily serving India’s demand for mid-tier and low-cost automotive and industrial springs. Germany and Japan, however, account for higher per-unit value due to advanced manufacturing standards. The United States maintains relevance in oilfield and aerospace-grade spring exports. Italy and Sweden supply high-end industrial springs used in hydraulic and process systems.This diversified structure ensures resilience in India’s import supply chain, minimizing dependency on any single source market.Regional Focus: Trade with ChinaIn India’s 2025 spring imports, China remained the most frequent trading partner. With over 21,000 shipments, Chinese manufacturers supplied a significant portion of standard mechanical and precision springs used in machinery, electronics, and vehicles. The price-performance ratio from Chinese suppliers continues to attract Indian SMEs, especially those in Tier 2 and Tier 3 manufacturing clusters such as Pune, Ahmedabad, and Coimbatore.However, India’s sustained trade with Germany, Japan, and the U.S. indicates a dual sourcing strategy: importing cost-efficient items from Asia and high-specification parts from Europe and North America.Industrial InterpretationThe 2025 data highlights India’s strong industrial rebound, reflected by the high import frequency of precision and heavy-duty springs. Several macro trends can be inferred:Manufacturing Expansion – Consistent monthly imports reveal growing demand in India’s automotive and machinery production sectors.Technological Upgrade – Imports from advanced economies suggest increasing adoption of high-performance mechanical components.Supply Chain Diversification – India sources from 70+ countries, mitigating risk amid shifting global logistics.Investment Correlation – Foreign Direct Investment (FDI) in manufacturing complements the steady inflow of critical mechanical components like springs.ConclusionIndia’s import performance under HS 73209090 illustrates a balanced combination of cost efficiency and technology-driven sourcing. The USD 71.86 million trade value for 2025 confirms the importance of springs in sustaining industrial productivity and assembly-line operations across sectors. With 5,334 exporters and 3,000 importers, the ecosystem reflects a competitive, globalized market environment.Going forward, India is expected to retain a strong import flow of springs to support its expanding automotive, energy, and manufacturing sectors. At the same time, localized production will likely rise under the “Make in India” initiative, gradually reducing dependency on imports for standardized components while maintaining imports for advanced technologies.Data SourceAll quantitative data and trade intelligence in this report are based on 2025 import records from NBD DATA, processed through its verified trade database.For deeper analytics or enterprise-level data services, please visit the NBD DATA Service Portal....

Offer

Indonesia’s Women’s Pants Exports Reached 100 Thousand USD in 2024

2026-01-26 11:39:43

In 2024, Indonesia exported women’s trousers and similar woven garments under HS Code 62046200, with a total export value of USD 100,320. These shipments—listed under WOMEN PANT in customs data—show Indonesia’s ongoing role as a key player in global apparel manufacturing, particularly for mid-range and specialized fashion orders.According to NBD DATA, exports reached 14 destination countries, involving 30 exporters and 18 importers. Despite the small trade value, the data highlight Indonesia’s flexibility in fulfilling diverse, small-batch production for international brands and private labels.Quarterly Export OverviewExports of women’s trousers from Indonesia in 2024 displayed a strong seasonal pattern, with peaks in Q1 and Q4, aligning with international production and fashion cycles.Q4 2024 was the most active period, accounting for 43% of total annual exports, as overseas retailers increased orders before the year-end fashion season.Meanwhile, Q3 saw stable shipments supporting autumn inventory cycles, while Q1 recorded early-year production deliveries to long-term clients in Asia and North America.Overall, Indonesia exported approximately 9,403 pieces of women’s pants throughout 2024, averaging USD 10.7 per piece.Key Exporters and Industrial InsightsIndonesia’s women’s pants exports were led by several internationally recognized garment manufacturers:PT. TAINAN ENTERPRISES INDONESIA – A subsidiary of Tainan Group, specializing in high-quality woven trousers for global retail brands, contributing significantly to Indonesia’s export base.PT ANDALAN MANDIRI BUSANA – A key player in tailored apparel, producing for mid-tier labels and private collections.PT. CITRA ABADI SEJATI – Exported garments for international names such as L.L. Bean, known for compliance with ethical and environmental standards.UNGARAN SARI GARMENTS – Focused on precision garment making and small-volume premium orders.SANDANG ASIA MAJU ABADI – Exported USD 98,671 worth of women’s pants in partnership with ASMARA INTERNATIONAL LIMITED, serving European markets.These enterprises highlight Indonesia’s strengths in quality control, flexible production, and export reliability, particularly for small and medium orders. Most are located in Java’s garment clusters, benefiting from established industrial infrastructure and skilled labor.Global Market DistributionIndonesia’s women’s trouser exports reached 14 countries in 2024, primarily destined for the United States, Japan, and Europe (notably Germany and France).Smaller consignments were shipped to Singapore, Malaysia, and Australia, supporting regional fashion retailers through ASEAN trade channels.This export model emphasizes adaptability—serving niche and private-label fashion brands that prefer multiple styles in smaller quantities rather than mass production.Indonesia’s flexible manufacturing model continues to distinguish it from competitors like China and Bangladesh, particularly in mid- to high-quality garment segments.Outlook for 2025Looking ahead, Indonesia’s women’s apparel exports are expected to remain stable or slightly increase as global retailers maintain demand for flexible, small-batch production.The rise of e-commerce brands and fast-response supply chains continues to benefit Indonesian manufacturers that can offer shorter lead times and customized orders.Challenges such as logistics costs and labor adjustments may persist, but innovation through automation, sustainable materials, and digital design is expected to strengthen Indonesia’s export competitiveness.Overall, 2025 is likely to bring continued resilience for Indonesia’s women’s pants sector, with stable trade performance and gradual value growth.Data SourceAll figures and corporate data are based on verified customs trade records analyzed by NBD DATA.For in-depth trade analytics, buyer–supplier mapping, and global apparel trend insights, please visit:https://en.nbd.ltd/service...

Offer

Fashion Retailers Drive Uruguay’s Sweater Import Market in 2025

2026-01-26 11:18:02

In 2025, Uruguay’s import market for knitted sweaters, pullovers, cardigans, and similar garments under HS Code 6110300010 demonstrated steady expansion, reaching a total import value of USD 24.47 million. These products—mainly described as SUETERES (JERSEYS), PULOVERES, CARDIGAN, and CHALECOS—reflect the growing appetite of Uruguayan consumers for warm, fashionable knitwear suited to both formal and casual occasions. According to data compiled by NBD DATA, 490 importers sourced from 44 countries, signaling a robust, diversified supply structure anchored in global fashion supply chains.Leading global retail groups such as ZARA, H&M, and Lolita S.A. played pivotal roles in shaping the import structure. Their operational scale, trend sensitivity, and efficient logistics channels helped Uruguay align with broader South American retail trends. The mid-price segment remained dominant, driven by fashion-conscious urban consumers seeking affordable yet stylish apparel.Monthly Trend OverviewMonthly data reveal clear seasonality in Uruguay’s sweater imports. Trade volume surged in February 2025, ahead of the autumn-winter retail season, with sustained inflows through the first half of the year and a moderate rise again toward December.Imports peaked in February, when shipments exceeded 465 tons, followed by a second-highest level in March. The period from May to September saw moderate import volumes as retailers transitioned between collections. By December, the total weight climbed again, preparing for the summer season and year-end retail promotions.Across 2025, Uruguay imported approximately 2,387 tons of sweaters and cardigans, reflecting stable supply and balanced demand throughout the year.Market Observation: Key Importers and Retail DynamicsUruguay’s knitwear imports were led by established retail chains closely tied to global apparel brands. The major importers included:LOJAS RENNER URUGUAY S.A. — Among the most active importers, managing 2,656 shipments valued at about USD 913 thousand.G.ZARA URUGUAY S.A. — The top importer by value (USD 2.16 million), focused on fast-fashion knitwear collections aligned with Inditex’s global product cycles.HENNES & MAURITZ URUGUAY S.A. — Imported USD 756 thousand worth of sweaters, emphasizing responsive sourcing and sustainability within its distribution model.LOLITA S A — A local fashion brand importing USD 1.39 million in knitwear for domestic retail expansion.UNILAM S A — Ranked among top importers with USD 2.69 million, maintaining consistent volume and diversified sourcing channels.Together, these companies accounted for a substantial share of total imports, highlighting Uruguay’s retail-oriented market structure. The integration of global logistics networks and digital inventory management has allowed these firms to synchronize stock levels with fast-changing consumer demand.Regional Trade FocusUruguay’s sweater imports in 2025 were mainly supplied by China, which continued to dominate the market due to its cost efficiency, product diversity, and speed of fulfillment. Bangladesh, Turkey, and Portugal followed as secondary sources, serving specific fashion and material niches such as wool blends and organic cotton lines.China’s sustained leadership underscores its adaptability to small and mid-sized Latin American markets, supplying both volume and design flexibility. Meanwhile, European exporters catered to higher-end retail and boutique segments, offering knitwear distinguished by quality craftsmanship and limited editions.Market Outlook for 2026The outlook for 2026 remains cautiously optimistic. Retail sales in Uruguay are projected to continue growing, supported by recovering household consumption and expanding e-commerce channels. The ongoing shift toward online and omnichannel models will further shape import patterns, emphasizing faster delivery and smaller, more frequent shipments.However, potential challenges include logistical costs and currency volatility, which could influence import pricing. Retailers are expected to respond by reinforcing partnerships with established suppliers in Asia and South America to maintain product flow and cost efficiency.Overall, the 2025 trade data reveal a resilient, fashion-driven market structure. Uruguay’s sweater imports will likely sustain steady growth, supported by consumer demand for accessible, quality knitwear and by the operational strength of leading global retailers.Data SourceAll trade statistics and company information are based on verified customs data processed and analyzed by NBD DATA.For enterprise-level access to detailed transaction records, supply chain maps, and long-term trend analytics, please visit:https://en.nbd.ltd/service...