Plastic Tray Exports from Vietnam: Electronics Packaging Drives Continuous Growth

Publishing Date:2026-01-16 16:18:00 Source: NBD Data(en.nbd.ltd)

In the first half of 2025, Vietnam’s export performance for plastic trays (HS 39231090) continued its upward momentum, strongly supported by the expansion of electronics manufacturing and packaging demand. According to NBD DATA, Vietnam exported approximately 138.4 million plastic trays during this period, reaching a total export value of USD 31.04 million across 23,662 trade records.

The export market remains dominated by high-tech and precision packaging applications, with “electronics tray” and “component packaging tray” appearing frequently in customs descriptions. The majority of these trays are used by electronics assemblers, camera module producers, and automotive component plants operating in northern Vietnam.

Monthly Export Trend

Vietnam’s monthly export trend for plastic trays in early 2025 shows a steady and balanced growth pattern, peaking in March and May:

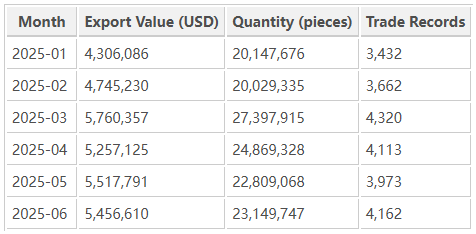
The first half of the year demonstrates a 6.7% overall increase compared to the same period in 2024. Demand was particularly strong from Japan, the United States, and China—countries with major investments in Vietnam’s electronics industry.

Market Observation: Leading Exporters and Key Buyers

Top Exporters

Vietnam’s export network for plastic trays is concentrated among a few large electronics packaging manufacturers and precision molding companies:

  • CANON VIETNAM CO LTD - QUE VO FACTORY – the largest exporter, contributing USD 6.85 million, primarily supplying Canon Inc. factories across Asia.

  • KYOCERA VIETNAM COMPANY LIMITED – key supplier to Japan and China, exporting USD 1.26 million worth of high-quality molded trays.

  • TSK VN– an industrial packaging firm exporting over 3 million trays to major electronic component assemblers.

  • ETOWA CO., LTD. – exported 1.6 million trays, servicing Nidec, Fujikura, and other precision manufacturers.

  • PALOMA VIETNAM COMPANY LIMITED – focused on mass-production of lightweight trays for general electronics packaging.

Major Global Buyers

The primary importers purchasing Vietnam-made plastic trays are concentrated in Japan, China, and the United States. Leading international partners include:

  • CANON INC.– purchases more than 200,000 trays monthly for printer and camera assembly lines.

  • KYOCERA CORPORATION– integrates Vietnamese trays in multi-country packaging operations.

  • TSK CORP. – coordinates supply for automotive component packaging in Japan.

  • NIDEC POWERTRAIN SYSTEMS CORPORATION – sources over 490,000 trays, reflecting strong demand in the motor assembly sector.

  • AAC TECHNOLOGIES VIET NAM – supplies molded trays for mobile device components and precision acoustic modules.

Together, these firms account for more than 55% of Vietnam’s total export volume of HS 39231090 products in the first half of 2025.

Main Export Destinations

Vietnam’s plastic tray exports are widely distributed across Asia and North America. The top five destinations by export value are as follows:

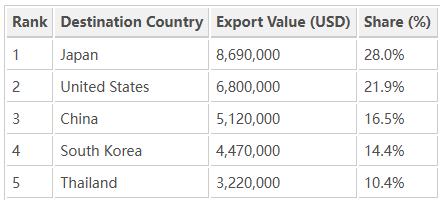
Japan remains the top destination, driven by long-term supply relationships with Canon, Kyocera, and Tamron factories. Meanwhile, the U.S. and South Korea show growing demand, reflecting shifts in electronics supply chains seeking cost-effective packaging alternatives in Vietnam.

Trend and Outlook

The export structure of Vietnam’s plastic tray industry reflects the country’s deep integration into global electronics supply chains. As investment in high-tech manufacturing continues to expand—particularly from Japan and South Korea—demand for molded and anti-static trays will likely grow further.

For the remainder of 2025, exports are expected to maintain a stable monthly volume of around 22–25 million trays, supported by increasing orders from camera, semiconductor, and electronic assembly industries. With continuous upgrades in mold precision and material innovation, Vietnam’s plastic tray producers are well positioned to capture more high-value packaging contracts.

Data Source

All figures are based on NBD DATA global customs database, analyzing Vietnam’s export declarations for HS 39231090 (Plastic Tray) between January and June 2025.
For detailed exporter directories, buyer profiles, or pricing intelligence, please visit the NBD DATA Service Page.

Related Recommendations

Offer

Trade Analysis of Mexico’s SOPORTE Exports: Data, Destinations, and Top Manufacturers

2026-01-16 15:45:33

In the first half of 2025, Mexico’s exports of SOPORTE— classified under HS Code 87089999— demonstrated solid performance within the automotive components sector. According to NBD DATA, the total export value reached USD 2.86 million across 1,358 recorded transactions from January to June 2025. These exports include structural supports, mounts, and brackets widely used in both vehicle manufacturing and aftermarket applications.Monthly Export TrendsMexico’s SOPORTE exports showed steady activity throughout early 2025, with the highest export value recorded in May 2025 at USD 760,383, followed by March and January. Early-year performance indicates robust regional demand for vehicle components across North and South America.Overall, Mexico exported SOPORTE products to 33 destination countries through 31 major exporters, serving assembly plants and distributors across North America, Latin America, and Europe.Key Importing Markets and ClientsExport records reveal Mexico’s critical role as a regional supplier of automotive components. Major international buyers include:FORD MOTOR COMPANY SA DE CV— The leading importer, with purchases totaling USD 442,365, mainly for vehicle chassis and mounting components.AUDI MEXICO S.A DE C.V.— Imported USD 106,506 in SOPORTE parts for export-oriented assembly lines.MAZDA MOTOR MANUFACTURING DE MEXICO S.A. DE C.V.— Recorded USD 13,429 in imports of specialized supports for compact vehicle assembly.VOLKSWAGEN DE MEXICO S.A. DE C.V.— Continued to source SOPORTE parts from local suppliers to sustain assembly operations.STELLANTIS MEXICO SA DE CV— Imported USD 5,527, reinforcing integration with regional automotive supply chains.Together, these firms represented nearly 70% of Mexico’s total SOPORTE export value in the first half of 2025, confirming Mexico’s strong position as an export base for automotive components.Top Mexican ExportersMexico’s export strength in SOPORTE products stems from a network of capable component manufacturers and distributors:VAZLO COMERCIAL S.A. DE C.V.— The top exporter, shipping goods worth USD 81,782, mainly to Central and South America.FUNDILAG HIERRO SA DE CV— Exported USD 214,586, including key shipments to JOHN DEERE USINE DE SARAN in France.GAFF INTERNATIONAL SA DE CV— Specialized in heavy-vehicle components, with total exports of USD 57,243.NORTH POLE STAR S DE RL DE CV— Recorded USD 161,965 in exports to POLARIS INDUSTRIES INC. in the U.S. market.INDUSTRIAS JOHN DEERE S DE RL DE CV— Delivered USD 66,190 worth of SOPORTE components to Argentina.These leading exporters illustrate Mexico’s advanced capability in precision metal fabrication and automotive component engineering, which underpin its global competitiveness.Regional Export DestinationsMexico’s SOPORTE exports reached a wide range of destinations, reflecting diversified demand across continents:United States – The primary export market, accounting for about 40% of total trade value.Brazil and Argentina – Key Latin American destinations for both OEM and aftermarket parts.Germany and France – European importers sourcing specialized supports for manufacturing networks.Costa Rica and Chile – Consistent smaller markets for vehicle assembly support parts.This spread highlights Mexico’s pivotal role in global automotive supply integration, supported by trade frameworks such as USMCA and the EU-Mexico Partnership Agreement.Market OutlookMexico’s SOPORTE exports are expected to continue expanding throughout 2025 due to:Strong vehicle production by multinational automakers operating in Mexico.Enhanced integration with U.S. and Latin American supply chains.Growth in precision casting and lightweight materials driven by technology investment.Potential challenges include steel price fluctuations, logistics costs, and emission regulations affecting component production. Nonetheless, the industry is shifting toward sustainable manufacturing and regional diversification to ensure long-term growth.Comprehensive data and enterprise analysis are available from NBD DATA, offering global insights into automotive component trade and market intelligence....

Offer

Trade Dynamics of Plastic Cap Imports in the Philippines: Data, Regions, and Top Companies

2026-01-16 15:39:03

In the first half of 2025, the Philippines’ imports of PLASTIC CAP (HS Code 39235000000) maintained a steady upward trajectory. According to NBD DATA, total import value reached USD 6.10 million with a total weight of 1,410 tons, spanning 1,413 trade transactions from January to June 2025. These plastic caps are widely used in beverage bottling, personal care, and industrial packaging, highlighting their essential role in the country’s manufacturing supply chain.Monthly Import TrendsThe Philippines demonstrated consistent import activity throughout the first half of 2025, with peaks in June and February. June registered the highest trade value at USD 1.36 million, accounting for more than one-fifth of the semester’s total. The February and May figures also reflected strong industrial demand, likely linked to beverage and consumer goods production cycles.During the six-month period, 21 exporting countries supplied 124 Philippine importers, with 146 exporters participating in the trade network.Key Importing CompaniesA handful of major industrial and consumer goods manufacturers led the market for plastic cap imports:COCA-COLA BEVERAGES PHILIPPINES INC.— The top importer, with trade worth USD 1.02 million and more than 307 tons of goods. Its suppliers include HON CHUAN (THAILAND) CO., LTD. and PACT GROUP CLOSURE SYSTEMS GUANGZHOU, forming a strong regional sourcing network.UNILEVER PHILIPPINES INC.— Imported USD 961 thousand in plastic caps, mainly from PLASTEK INDUSTRIES INC. (U.S.) and JIANGMEN NEWLINE IMPORT & EXPORT CO., LTD. (China) for packaging personal care products.PILIPINAS KYOHRITSU INC.— Brought in USD 565 thousand of imports, working closely with SUMITOMO WIRING SYSTEMS for automotive-related components.EPL PROPACK PHILIPPINES INC.— Reported USD 284 thousand worth of imports from EPL PACKAGING (GUANGZHOU) and FOSHAN HUIHONG PLASTIC, both based in China.CAJ PACKAGING SOLUTIONS INC.— Focused on pharmaceutical packaging, with imports of USD 112 thousand supplied by APTAR PHARMA INDIA PRIVATE LIMITED.These companies together accounted for more than 65% of total import value, emphasizing the concentration of trade among leading multinationals with vertically integrated supply chains.Major Exporting PartnersThe Philippines sourced its plastic caps mainly from neighboring and industrialized countries, led by Thailand, China, the United States, and India.HON CHUAN (THAILAND) CO., LTD.— The largest exporter to the Philippines, with transactions exceeding USD 924 thousand, supporting Coca-Cola’s regional production.PLASTEK INDUSTRIES INC.— U.S.-based packaging manufacturer with shipments worth USD 927 thousand, mainly to Unilever Philippines.EPL PACKAGING (GUANGZHOU) LIMITED— Supplied high-precision caps valued at USD 170 thousand to EPL Propack.APTAR PHARMA INDIA PRIVATE LIMITED— Provided pharmaceutical-grade closures worth USD 112 thousand.FOSHAN HUIHONG PLASTIC— Exported USD 113 thousand of cap materials for flexible packaging.This highlights a regional triangle of trade among China, Thailand, and the Philippines, where short logistics distances and specialization in plastics manufacturing foster efficient supply flows.Regional Trade OverviewSoutheast Asia remained the Philippines’ primary import source for plastic caps, followed by East Asia and the United States. Thailand’s strong presence underscores its advanced packaging industry, while China’s growing role reflects cost advantages and expanding product diversity.The structure demonstrates the Philippines’ reliance on regional sourcing resilience, balancing price efficiency and product quality through long-term supplier relationships.Market OutlookThe import outlook for plastic caps in 2025 remains optimistic, driven by:Strong beverage and consumer goods demand across the domestic market.Expansion of local bottling and packaging facilities by global brands.Deeper integration with regional suppliers in ASEAN and East Asia.Potential risks include higher raw material prices, logistical uncertainties, and environmental pressures to adopt recyclable and biodegradable plastics. Nevertheless, industry players are expected to pursue supply diversification and sustainability initiatives to maintain competitiveness.Detailed trade data and enterprise profiles are available from NBD DATA, providing professional insights into the global packaging and manufacturing supply chain....