China Dominates Ghana’s Cooking Pot Market as Household Demand Expands
In the first half of 2025, Ghana’s import market for cooking pots (HS Code 7323999000
The market structure reveals an interesting pattern: China overwhelmingly dominated Ghana’s cooking pot imports, accounting for nearly 90% of the total trade value, followed by smaller contributions from India and the United Arab Emirates. This continued reliance on Chinese cookware underscores the deepening trade relationship between Accra and Beijing, particularly in consumer goods and light household industries.
Monthly Trade Overview
During the first half of 2025, Ghana’s cooking pot imports fluctuated moderately but showed a general upward trend in the second quarter.
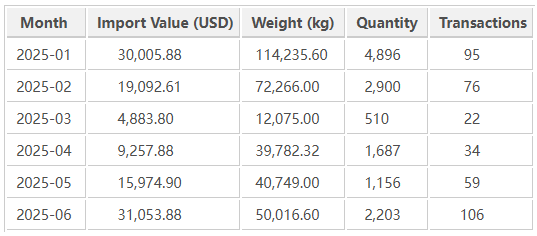
After a low point in March, imports rebounded significantly from April onward, reaching their highest monthly value in June (USD 31,053.88). The surge was primarily driven by restocking from Chinese suppliers and the seasonal increase in consumer demand during the mid-year shopping period.
Market Overview and Key Insights
The import data shows that Ghana sourced cooking pots from five countries, with China firmly positioned as the primary supplier. Nearly all import transactions involved Chinese exporters and Ghanaian small and medium-sized trading firms. The dominance of Chinese products is attributed to their affordability, diverse designs, and wide availability in materials ranging from stainless steel to aluminum.
Average import price: approximately USD 0.33 per kilogram, highlighting the low-cost mass-market nature of the products imported.
Average shipment volume: around 840 kg per transaction, suggesting that imports are typically handled by medium-sized wholesalers catering to domestic retailers and local markets.
Leading Importers in Ghana
A group of Ghanaian enterprises played a key role in channeling imported cooking pots into the domestic market. Many of these businesses are small to medium-sized trading companies located in Accra and Kumasi, which serve as distribution centers for household goods across the country.
Top importers in the first half of 2025 include:
ZHE NAN CO., LTD. – The most active importer, responsible for 60 shipments totaling USD 7,306 and 12.6 tons of cooking pots, sourced through YIWU OLINA IMPORT & EXPORT CO., LTD.
DANIEL KWAKU APPIAH– Imported USD 4,137 worth of cookware, mainly from JINJIANG QILONG TRADING CO., LTD. and YIWU DOWELL TRADE LTD.
MONICA ABRAFI – Recorded USD 7,734 in imports, largely from A & G TRADING CO., LTD., demonstrating growing female-led participation in Ghana’s import trade sector.
KANN TRUE LOVE ENTERPRISE – Imported USD 4,793, relying on multiple suppliers such as YIWU DOWELL TRADE LTD. and JINJIANG QILONG TRADING CO. LTD.
MIDWORD ENTERPRISE – Imported USD 1,457, showing steady involvement in household goods distribution.
These importers operate mainly as intermediaries, importing containers or partial shipments from Asia, then distributing the products to wholesalers, open markets, and regional retail chains.
Key Suppliers to Ghana
The trade data indicates that Chinese companies are the dominant exporters of cooking pots to Ghana. They account for over 85% of total transactions and supply a wide range of aluminum, enamel, and stainless-steel cookware.
Top Chinese exporters include:
YIWU OLINA IMPORT & EXPORT CO., LTD. – The single largest supplier to Ghana’s cookware importers.
JINJIANG QILONG TRADING CO., LTD. – Partnered with multiple Ghanaian buyers such as MONICA ABRAFI and K ANN TRUE LOVE ENTERPRISE.
YIWU DOWELL TRADE LTD.– A key exporter in small appliances and kitchenware.
A & G TRADING CO., LTD. – Exported cooking pots to Ghanaian enterprises valued at over USD 5,700.
GUANGDONG TENG YU TRADE CO., LTD. – Specializes in stainless-steel cookware for West African markets.
The strong presence of Yiwu-based trading companies reflects the city’s role as a global hub for affordable consumer goods. These suppliers have built extensive networks with African importers through digital platforms and trade fairs, further cementing China’s dominance in this segment.
Trade Dynamics and Regional Context
The Ghanaian market for cooking pots and general kitchenware has expanded steadily in recent years, driven by:
-
Urbanization and population growth: The expansion of urban centers has increased the demand for household essentials.
-
Rising middle-class consumption: Growth in disposable income has boosted spending on durable and aesthetically appealing cookware.
-
Hospitality and food industry expansion: The proliferation of restaurants, hotels, and catering services contributes to the growing import demand.
-
Regional distribution: Ghana serves as a re-export hub for neighboring countries like Togo, Côte d’Ivoire, and Burkina Faso.
Given its strategic port access through Tema and Takoradi, Ghana continues to attract exporters seeking to reach West African consumers efficiently.
Market Trends and Outlook
-
Chinese dominance to continue: The affordability and adaptability of Chinese cookware products are unmatched, and this dominance is expected to persist through 2025.
-
Shift toward higher quality: While low-cost aluminum cookware remains prevalent, there is a noticeable rise in demand for stainless-steel and induction-compatible pots.
-
Potential for local manufacturing: With increasing imports and consistent demand, Ghana may gradually explore local assembly or finishing of cookware to reduce dependency.
-
E-commerce integration: Small importers are increasingly utilizing digital marketplaces like Alibaba and Made-in-China for direct sourcing, improving margins and access to variety.
Overall, the import data suggests that Ghana’s cooking pot market will continue to grow modestly, aligning with trends in consumer durables and food-related sectors.
Summary
Between January and June 2025, Ghana imported over USD 110,000 worth of cooking pots, equivalent to more than 329 metric tons of goods. The trade was overwhelmingly dominated by Chinese suppliers, with local Ghanaian SMEs handling most of the imports.
As consumer demand continues to rise alongside the country’s economic development, the cookware segment will remain a reliable indicator of household spending trends in Ghana. China’s role as the primary supplier ensures a consistent flow of affordable, diverse kitchen products to Ghanaian homes and businesses.
Data Source
All trade statistics and company data in this report are derived from NBD DATA
For more insights or enterprise-level analytics, please visit NBD DATA Service