Uzbekistan July 2024 Import Data Analysis: Latest Trends in Trade Regions and Product Categories

Publishing Date:2024-08-21 11:42:33 Source: NBD Data(en.nbd.ltd)

The customs import data for Uzbekistan in July 2024 reveals some critical shifts and potential trends in the country's trade activities. A detailed analysis of these data points sheds light on Uzbekistan's position within the global supply chain and how domestic demand fluctuations are influencing its import structure. Here are some key insights based on the data.

Overall Import Trends Analysis

In July 2024, Uzbekistan's total import value reached $4.275 billion, representing a month-on-month increase of 17.89%, yet a year-on-year decline of 4.97%. This indicates that while Uzbekistan shows some resilience in the face of global economic uncertainties—such as supply chain pressures and international trade frictions—certain macroeconomic factors like inflation, currency fluctuations, or subdued domestic demand may be restraining import growth.

Notably, despite the decline in import value, the number of importers and suppliers saw slight increases, with year-on-year growth rates of 0.42% and 0.56%, respectively. This suggests that Uzbekistan’s market is gradually diversifying, with more businesses engaging in international trade, although the overall volume of transactions has decreased.

Market Trends in Major Import Categories

Among the different product categories, Books, Newspapers, and Printed Material (HS Code 490700) saw a staggering month-on-month import value increase of 123.89% and a year-on-year rise of 89.38%. This significant growth may be linked to rising domestic demand for cultural and educational materials. Additionally, the increased import volume of printed media might reflect government or institutional investments in information dissemination and educational initiatives.

Petroleum and Mineral Fuels (HS Code 271019) experienced a year-on-year import value growth of 153.99%, despite a slight month-on-month decline. This trend points to strong energy demand in Uzbekistan, possibly driven by industrial expansion or seasonal energy consumption increases. It may also indicate that the country is boosting imports to ensure energy supply stability amid global market uncertainties.

Pharmaceuticals (HS Code 300490) and Perfumes and Cosmetics (HS Code 330210) also showed significant growth, with year-on-year increases of 31.20% and 202.03%, respectively. The rise in pharmaceuticals might be attributed to heightened public health awareness and expanded healthcare resources. Meanwhile, the surge in cosmetics imports likely reflects the growth of Uzbekistan's consumer market and the rising purchasing power of the middle class, alongside evolving consumer preferences.

China's Role in Uzbekistan's Import Market

China remains one of Uzbekistan’s most crucial trading partners. In July, imports from China continued to be dominated by Mobile Phones and Components (HS Code 851713) and Automobiles (HS Code 870360). However, it's worth noting that the volume and value of automobile imports dropped by 51.40% year-on-year, possibly due to market saturation or shifting consumer preferences within Uzbekistan. On the other hand, the significant growth in Battery Imports (HS Code 850760) highlights the potential development of the renewable energy or electric vehicle market.

Trends in Key Trade Regions

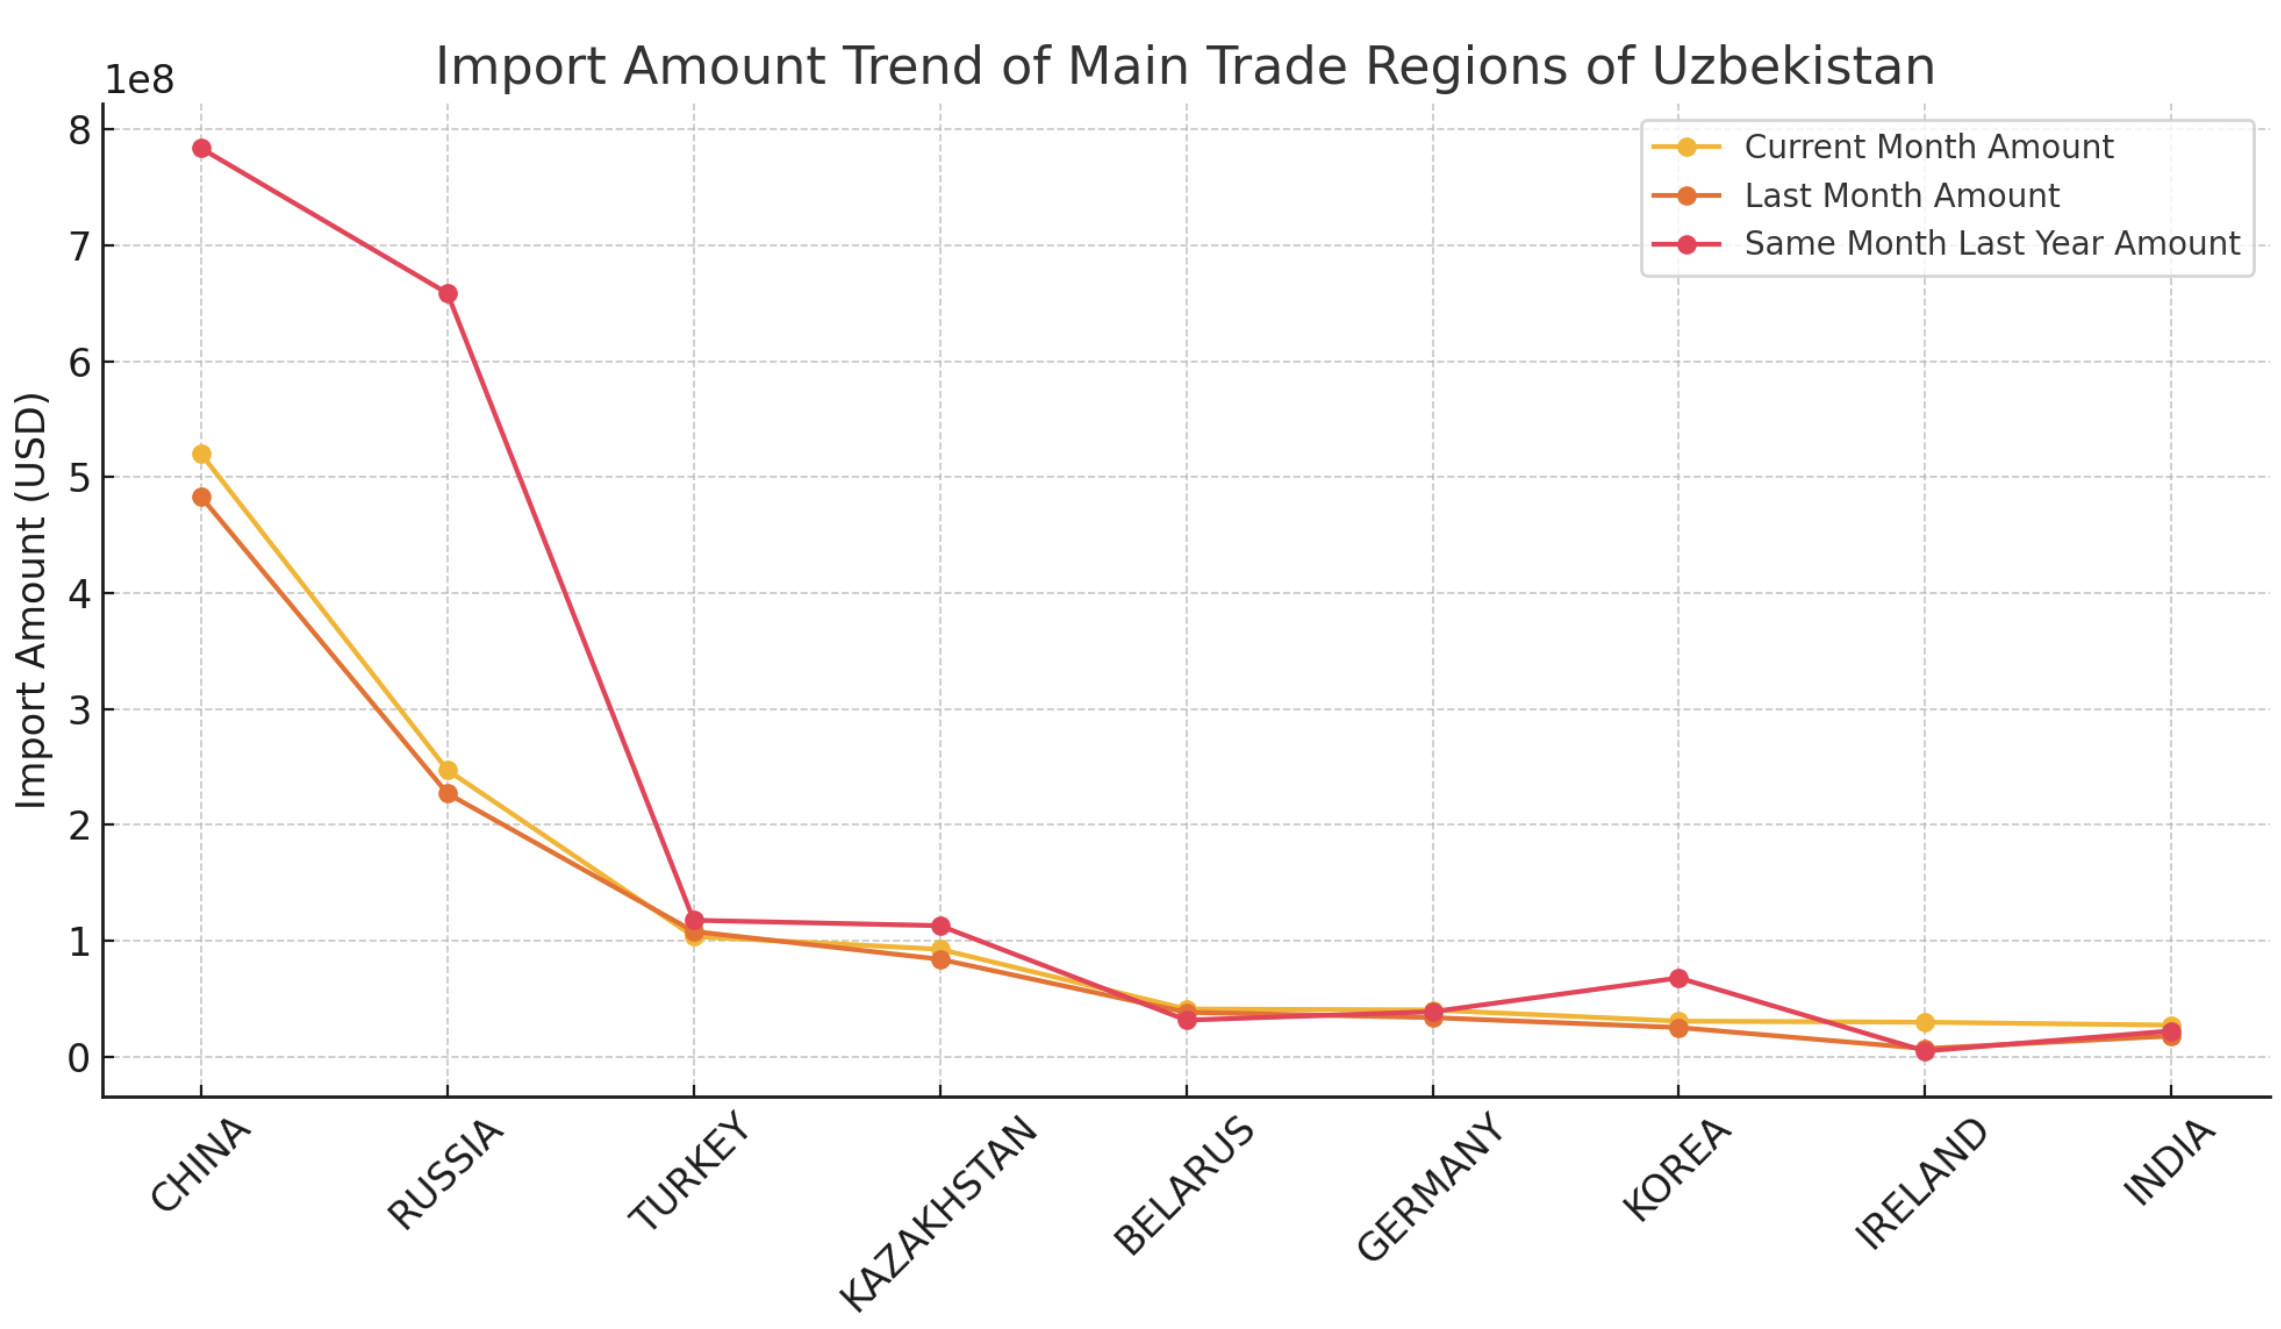
Among the major trade regions, China, Russia, and Turkey continue to be vital sources of imports for Uzbekistan. However, the import value from China and Russia has seen significant year-on-year declines, particularly from Russia, where imports fell by a staggering 62.45%. This could be linked to geopolitical changes, sanctions, and the reconfiguration of supply chains. In contrast, although Turkey's import value also dropped, the decrease was less pronounced, indicating that Turkey remains competitive in the Uzbek market.

Import data from Kazakhstan and Belarus shows some resilience, with both countries registering month-on-month increases in import value. This suggests that regional trade links remain strong. Particularly, Belarus saw a year-on-year import value growth of 30.48%, possibly indicating that Uzbekistan is strengthening its trade ties with Belarus in strategic product categories.

Conclusion and Outlook

Overall, the customs import data for Uzbekistan in July 2024 highlights the country's complex dynamics in international trade. While some products and regions have seen a decline in import value, Uzbekistan's market remains active, with a growing trend towards import diversification. NBD Data (www.nbd.ltd) will continue to closely monitor trade developments between Uzbekistan and its key partners, providing businesses with the latest customs data insights to help them seize opportunities and mitigate risks in the global market.

Disclaimer: The data and analysis in this report are derived from NBD Data's statistical results and may contain some errors. Users should verify these data independently. NBD Data is not responsible for any consequences arising from the use of this report's information.

For more detailed data, please visit NBD Data's official website: en.nbd.ltd

Related Recommendations

Offer

Hot Topic! 2024 August Philippines Import Data and Market Trends

2024-09-17 16:24:37

The Philippines, as a crucial trade hub in Southeast Asia, has consistently shown a diverse import market. The customs import data for August 2024 reflects the vibrancy of its foreign trade and changing market demands. This report provides an in-depth analysis of these data, examining the types of imported goods, key importers, imports from China, and major trade partners to offer valuable insights for foreign trade professionals.Overview of Philippines Import Data in August 2024:According to the customs data for August 2024, the Philippines recorded a total of 747,215 import entries, a 4.36% decrease from last month's 790,880 entries. Compared to the same period last year, there was a 6.91% increase from 698,913 entries. The total import value reached $11.72 billion, a 4.00% decrease from the previous month’s $12.21 billion but a 3.33% increase compared to $11.34 billion in the same month last year.On the importer side, 21,176 Philippine importers were involved in this month's activities, showing a month-on-month decrease of 1.08% but a year-on-year increase of 2.82%. Regarding suppliers, 54,983 companies supplied goods to the Philippines, with a month-on-month decrease of 5.68% and a year-on-year decrease of 0.35%. These figures indicate that despite a slight decrease in this month’s import activity, the overall trend remains positive, demonstrating the stability and diversity of the Philippine import market.Top Five Imported Goods in the Philippines This Month:Integrated Circuits and Components (HS Code 854239): The total import value this month was $745 million, down 9.19% from the previous month and 10.46% year-on-year. This category is crucial to the electronics industry, and the decline might reflect global supply chain disruptions or changes in the demand for electronics within the Philippines.Crude Oil and Petroleum (HS Code 270900): The import value reached $576 million, with a month-on-month increase of 37.10% and a year-on-year growth of 98.76%, almost doubling. This increase could be linked to international oil price fluctuations and the growing energy demand in the Philippines.Petroleum Products and Lubricants (HS Code 271019): The total import value stood at $531 million, showing a decrease of 6.13% month-on-month and 44.33% year-on-year. The drop in import value could be due to global oil price adjustments, increased use of alternative energy sources, or reduced domestic demand.Petroleum Condensates (HS Code 271012): The import value was $325 million, down 2.51% month-on-month and 25.76% year-on-year. This is related to global oil market fluctuations and adjustments in domestic energy demand in the Philippines.Anthracite (HS Code 270119): The import value was $273 million, slightly down 6.00% month-on-month but up 10.35% year-on-year. This suggests an increase in demand for high-quality fuels in the Philippines, possibly for electricity production and industrial use.Key Importers in the Philippines for Major Goods:In the Philippine import market, some importers have shown outstanding performance in purchasing various categories of goods. Here are the main importers for the top five imported goods this month:Integrated Circuits and Components (HS Code 854239):TI (PHILIPPINES) INC.: $193 million, with a month-on-month increase of $4.23 million.SFA SEMICON PHILIPPINES CORP.: $147 million, with a month-on-month decrease of $49.15 million.ANALOG DEVICES GEN TRIAS INC.: $78.44 million, with a month-on-month increase of $3.34 million.Crude Oil and Petroleum (HS Code 270900):PETRON CORPORATION: $576 million, with a month-on-month increase of $156 million.Petroleum Products and Lubricants (HS Code 271019):PILIPINAS SHELL PETROLEUM CORP.: $128 million, with a month-on-month increase of $2.77 million.UNIOIL PETROLEUM PHILIPPINES INC.: $91.83 million, with a month-on-month increase of $26 million.Petroleum Condensates (HS Code 271012):UNIOIL PETROLEUM PHILIPPINES INC.: $66.84 million, with a month-on-month increase of $12.45 million.J G SUMMIT OLEFINS CORP.: $53.35 million, with a month-on-month increase of $16.19 million.Anthracite (HS Code 270119):GN POWER DINGININ LTD. CO.: $39.89 million, with a month-on-month increase of $15.20 million.Philippines’ Major Trade Partners:China: As the largest trade partner of the Philippines, China's total export value to the Philippines was nearly $3 billion this month. Although there was a month-on-month decrease of $328 million, there was a year-on-year increase of $473 million. This suggests that despite short-term fluctuations, the long-term China-Philippines trade relationship remains on a growth trajectory.Indonesia: Ranking second, the total export value was approximately $1.057 billion, with a month-on-month increase of $82.97 million and a year-on-year increase of $94.99 million, indicating steady growth in trade with the Philippines.Korea: With a total export value of $908 million, Korea experienced a month-on-month increase of $61.15 million and a year-on-year increase of $118 million, showing an upward trend in exports to the Philippines, highlighting the close cooperation between the two countries in goods trade.Japan: Although the export value to the Philippines was around $820 million this month, it saw a month-on-month decrease of $142 million and only a $11.04 million increase year-on-year, indicating potential volatility in Japan-Philippines trade.United States: Ranking fifth with $760 million, showing slight month-on-month growth but a year-on-year decrease of $105 million, possibly due to market demand changes or tariff policy adjustments.Other key trade partners include Thailand, Vietnam, Singapore, Malaysia, and Taiwan (China), with some countries like Vietnam showing significant month-on-month growth.Philippines Exchange Rate Trend:Over the past 12 months, the Philippine Peso to USD exchange rate has shown an overall upward trend. From 56.82 in September 2023 to 57.24 in August 2024, this fluctuation indicates a relative depreciation of the Peso against the USD. This trend may be influenced by global market changes, the Philippine economic environment, and international trade conditions.Conclusion:The August 2024 customs data of the Philippines reveals changes in various import sectors. The demand for goods like integrated circuits, petroleum products, and motor vehicles highlights the ongoing development in the Philippines' manufacturing, technology, and consumer markets. The variety and significant value of goods imported from China reflect the deepening China-Philippines trade relationship.Major trade partners like China, Indonesia, Korea, and Japan underscore the Philippines' close trade connections with East and Southeast Asia. Meanwhile, the upward trend in the Peso's exchange rate against the USD poses new challenges for importers regarding costs and pricing strategies.Disclaimer: The data and analysis in this report are derived from NBD Data's statistical results and may contain some errors. Users should verify these data independently. NBD Data is not responsible for any consequences arising from the use of this report's information.For more detailed data, please visit NBD Data's official website: en.nbd.ltd...

Offer

Comprehensive Analysis of India’s July 2024 Import Data

2024-08-28 13:18:20

In July 2024, India’s import data revealed significant trends and shifts across various sectors. Leveraging our expertise at NBD Data, we provide a detailed analysis of these trends, using our comprehensive customs data services. This report will cover key import categories, trade relationships, and future predictions based on year-over-year (YoY) and month-over-month (MoM) data changes.1. Overall Import Data OverviewIn July 2024, the total number of import records for India stood at 5,412,231, marking a decrease of 21.55% compared to the previous month and a YoY decline of 25.31%. Despite this decrease in the number of records, the total import value reached $79.92 billion, representing a MoM increase of 50.00% and a YoY growth of 48.57%. The data also shows a slight increase in the number of buyers and suppliers, reflecting sustained activity in the Indian market.2. Analysis of Key Import Categories and PredictionsThe top five import categories for India in July 2024 are as follows:HS Code 270900: Petroleum and its products – Import value: $19.22 billion, MoM growth of 97.55%, and YoY growth of 71.47%. The significant rise in petroleum imports underscores India's growing energy demands. Given the volatile nature of global oil prices and India’s heavy reliance on imports, we anticipate continued high levels of petroleum imports in the coming months.HS Code 270119: Coal and coal products – Import value: $3.77 billion, MoM growth of 63.93%, and YoY growth of 65.53%. The demand for coal remains robust, driven by India's energy requirements. However, as the country transitions towards renewable energy, the growth rate may moderate in the future.HS Code 710812: Precious metals and related products – Import value: $3.18 billion, MoM growth of 19.82%, and YoY growth of 41.05%. The appetite for precious metals, often seen as a safe investment, is likely to persist amidst global economic uncertainties.HS Code 151110: Edible vegetable oils – Import value: $1.94 billion, MoM growth of 81.81%, and YoY growth of 74.05%. With rising domestic demand for food products, we expect stable growth in this category.HS Code 854231: Semiconductors and electronic components – Import value: $1.60 billion, MoM growth of 20.89%, and YoY growth of 34.34%. As the digital economy expands, the demand for semiconductors is predicted to increase, driving further imports in this category.These categories indicate strong demand in the energy and technology sectors, reflecting broader global trends. We predict continued growth in these sectors, particularly in technology-related imports, as India accelerates its digital transformation.3. Imports from the United States: Key Categories and TrendsFocusing on India’s imports from the United States, the top five product categories in July 2024 were:HS Code 270900: Petroleum and its products – Total value: $584.31 million, MoM growth of 295.27%, but with a slight YoY decrease of -0.13%. This category continues to dominate due to the ongoing energy needs.HS Code 270119: Coal and coal products – Total value: $507.72 million, MoM growth of 310.23%, and YoY growth of 78.90%.HS Code 270799: Other mineral fuels – Total value: $326.52 million, MoM growth of 155.88%, and YoY growth of 110.10%.HS Code 841112: Turbojets and turbopropellers – Total value: $202.16 million, MoM growth of 89.96%, though with a YoY decrease of -51.47%.HS Code 220720: Ethyl alcohol and other spirits – Total value: $150.70 million, MoM growth of 421.96%, and YoY growth of 644.25%.The data suggests a strong focus on energy-related products and specialized machinery. Given the strategic partnership between the U.S. and India, these categories are likely to see sustained growth.4. Top 10 Trade Regions Exporting to IndiaThe top 10 regions exporting to India in July 2024 are:These numbers highlight India’s diverse import relationships, with China, Russia, and the United States being the largest contributors. The high growth rates from regions like Russia and Saudi Arabia emphasize the importance of these trade relationships in meeting India’s growing demands.ConclusionThe analysis of India’s July 2024 import data reveals dynamic shifts and strong growth across several key sectors. NBD Data continues to monitor these trends closely, providing actionable insights to help businesses navigate the evolving trade landscape.Disclaimer: The data and analysis in this report are derived from NBD Data's statistical results and may contain some errors. Users should verify these data independently. NBD Data is not responsible for any consequences arising from the use of this report's information....

Offer

Uruguay Customs Import Data Update - July 2024

2024-08-09 15:42:48

I. Overall Data OverviewIn July 2024, Uruguay's import activities demonstrated significant growth, reflecting the country's robust demand in the global supply chain. Despite a 13.78% month-on-month decrease in the total number of import records and a 10.55% year-on-year decrease, the total import value surged. The total import value for this month reached USD 1.89 billion, representing a 21.73% increase from the previous month and an 11.81% increase compared to the same period last year. This growth indicates strong demand for high-value goods in Uruguay.The number of active buyers also increased this month, reaching 5,467, a rise of 8.09% month-on-month and 6.67% year-on-year. This data suggests a more dynamic market with increased participation from various enterprises.II. Top 5 Imported Product CategoriesUruguay's top five imported product categories in July 2024 showed diverse demand across different sectors:HS Code 470329 - Other Pulp: The total import value for this category was USD 180.78 million, marking a 50.58% month-on-month increase and a 60.21% year-on-year increase. This significant growth underscores the strong demand for raw materials in Uruguay's industrial sector.HS Code 271600 - Electrical Energy Products: This category maintained a stable import value of USD 112 million, with no month-on-month change but a substantial 47.37% year-on-year increase. This stability reflects Uruguay's ongoing investments in energy supplies.HS Code 270900 - Crude Oil and Petroleum Products: The total import value for this category was USD 87.06 million. Despite having no import data for the previous month, this category saw a 12.67% year-on-year increase, indicating continued demand for petroleum in Uruguay.HS Code 300490 - Pharmaceutical Products: This category saw an import value of USD 52.11 million, with a 35.99% month-on-month increase but a 4.72% year-on-year decrease. This fluctuation reflects the dynamic nature of the pharmaceutical market.HS Code 330210 - Fragrances and Flavors: The import value for this category was USD 42.22 million, with a 4.47% month-on-month decrease but a 3.52% year-on-year increase, suggesting a stable demand for fragrance products.III. Top 5 Products Imported from the United StatesThe following are the top five product categories imported from the United States to Uruguay:HS Code 330300 - Perfume and Cosmetics: The total import value for this category was USD 5.21 million, reflecting a 5.10% month-on-month decrease and a 13.88% year-on-year decrease. Despite these declines, cosmetics remain a key import from the U.S.HS Code 852872 - Television Receivers: This category experienced a significant month-on-month increase of 120.23% and a 156.87% year-on-year increase, with a total import value of USD 3.75 million. The strong demand for electronics is evident in these figures.HS Code 841510 - Air Conditioning Machines: The import value for this category was USD 1.40 million, showing a remarkable 707.08% month-on-month increase and a 519.70% year-on-year increase. The surge in demand for air conditioning units is particularly noteworthy.HS Code 220830 - Whisky: This category saw a total import value of USD 1.21 million, reflecting a 22.43% month-on-month decrease and a 25.90% year-on-year decrease. The decline may suggest changes in consumer preferences or market conditions.HS Code 220421 - Wine: The total import value for wine was USD 1.01 million, with a 140.91% month-on-month decrease and a 29.42% year-on-year decrease, indicating a significant drop in wine imports.IV. Top 10 Trade Regions Exporting to UruguayUruguay's import sources were diverse, with the top 10 regions contributing significantly to the overall import value:Uruguay (Domestic Imports): Totaling USD 483.12 million, this category saw a 23.49% month-on-month increase and a 10.80% year-on-year increase, indicating a strong internal trade flow.Brazil: Imports from Brazil reached USD 374.25 million, with a 17.56% month-on-month increase and a 26.17% year-on-year increase, reflecting robust trade ties.China: Imports from China amounted to USD 221.76 million, with a 36.48% month-on-month increase and a 50.38% year-on-year increase, highlighting China's growing importance as a trade partner.Argentina: Argentina's exports to Uruguay totaled USD 178.82 million, showing a 16.25% month-on-month increase but a 19.63% year-on-year decrease, suggesting possible shifts in trade dynamics.Turkey: Imports from Turkey surged to USD 95.29 million, a staggering 1027.28% month-on-month increase and a 590.25% year-on-year increase, indicating a dramatic rise in trade activity.Unknown: Imports from unknown regions totaled USD 92.03 million, with a 13.46% month-on-month increase and a 19.86% year-on-year increase, reflecting growing trade from less defined regions.Paraguay: Imports from Paraguay reached USD 48.17 million, with a 37.44% month-on-month increase but a 17.96% year-on-year decrease, showing mixed trends.Mexico: Imports from Mexico totaled USD 38.49 million, a 17.24% month-on-month decrease but a 4.03% year-on-year increase, indicating moderate trade activity.United States: Imports from the U.S. amounted to USD 30.41 million, with a 21.76% month-on-month increase and a 19.96% year-on-year increase, maintaining the U.S.'s strong trade presence.Germany: Imports from Germany totaled USD 22.22 million, with a 3.70% month-on-month decrease and a 13.69% year-on-year decrease, reflecting a decline in trade with Germany.ConclusionUruguay's import activity in July 2024 showed strong growth, particularly in high-value product categories such as energy products, pharmaceuticals, and automotive components. The data suggests that Uruguay's demand for essential goods and advanced technologies remains strong. NBD Data will continue to monitor global market trends to provide the most accurate and up-to-date customs data analysis to help businesses capitalize on emerging opportunities.Disclaimer: The data and analysis in this report are derived from NBD Data's statistical results and may contain some errors. Users should verify these data independently. NBD Data is not responsible for any consequences arising from the use of this report's information.For more detailed information, please visit NBD Data's official website....