Paraguay Customs Import Data Update - July 2024

Publishing Date:2024-08-09 14:03:59 Source: NBD Data(en.nbd.ltd)

Overview

In July 2024, Paraguay's import activities showed significant fluctuations across various sectors, reflecting both global economic conditions and specific domestic demands. According to the latest data provided by NBD Data, the total number of import entries recorded this month reached 116,468, marking an increase of 22.50% from the previous month’s 94,659 entries. Year-over-year, the total entries saw a rise of 19.32% compared to July 2023, which recorded 97,611 entries.

The total import value for July 2024 amounted to $2.23 billion, a substantial increase of 26.79% from the previous month's $1.76 billion, and a 15.37% rise year-over-year from July 2023's $1.93 billion. The number of importers also saw a notable rise, with 3,597 registered importers, up by 8.87% from June 2024 and 12.38% compared to July 2023.

Top Imported Commodities

Paraguay’s top five imported commodities for July 2024 cover a diverse range of sectors, reflecting the country's ongoing industrial and agricultural needs:

  1. HS 310520 - Mineral or Chemical Fertilizers: The import value for this category reached $245.59 million, marking an 82.09% increase from the previous month and an 18.92% rise year-over-year. This significant growth highlights the continued demand for fertilizers to support Paraguay's agricultural sector.

  2. HS 271019 - Petroleum Oils and Oils Obtained from Bituminous Minerals: Imports in this category totaled $168.49 million, reflecting a 7.75% month-over-month increase and a 37.24% year-over-year rise. This increase underscores the country's reliance on petroleum products for energy and industrial purposes.

  3. HS 851713 - Mobile Phones and Wireless Communication Devices: The import value for these goods was $139.11 million, up by 19.37% from June 2024. However, there was a significant 33.96% decrease year-over-year, indicating a potential saturation in the market or changes in consumer preferences.

  4. HS 271012 - Light Oils and Preparations: Imports in this category reached $121.62 million, marking a 4.78% month-over-month increase and a substantial 76.17% year-over-year growth. The demand for light oils reflects the broader needs of the transportation and manufacturing industries.

  5. HS 310420 - Potassium Fertilizers: The import value was $97.14 million, with a 53.15% month-over-month increase and a 61.90% year-over-year rise, highlighting the importance of potassium fertilizers in supporting crop yields.

Top Imports from the United States

The United States remains a key trading partner for Paraguay, contributing significantly to the country’s import profile. The top five imported commodities from the U.S. are as follows:

  1. HS 851713 - Mobile Phones and Wireless Communication Devices: Paraguay imported $96.47 million worth of these goods in July 2024, a 20.26% increase from June 2024. However, there was a 48.48% decrease year-over-year, suggesting shifting trends in consumer demand.

  2. HS 847130 - Portable Digital Computers: Imports totaled $30.99 million, a 22.89% month-over-month increase, yet a slight 1.20% decrease year-over-year. The steady demand for digital technology reflects the growing need for connectivity and remote work solutions.

  3. HS 271019 - Petroleum Oils and Oils Obtained from Bituminous Minerals: Imports from the U.S. amounted to $13.75 million, marking a 5.88% increase from June 2024 and a 221.41% increase year-over-year, indicating a strong reliance on U.S. petroleum products.

  4. HS 851762 - Data Processing Machines: Imports in this category were $13.01 million, a slight decrease of 10.63% month-over-month, yet a 12.35% increase year-over-year, showcasing the continued importance of data and communication technologies.

  5. HS 852589 - Video Cameras and Other Recording Devices: Imports reached $9.36 million, with a 18.71% month-over-month increase and a significant 86.45% year-over-year rise, highlighting the increasing demand for surveillance and media technology.

Key Export Regions to Paraguay

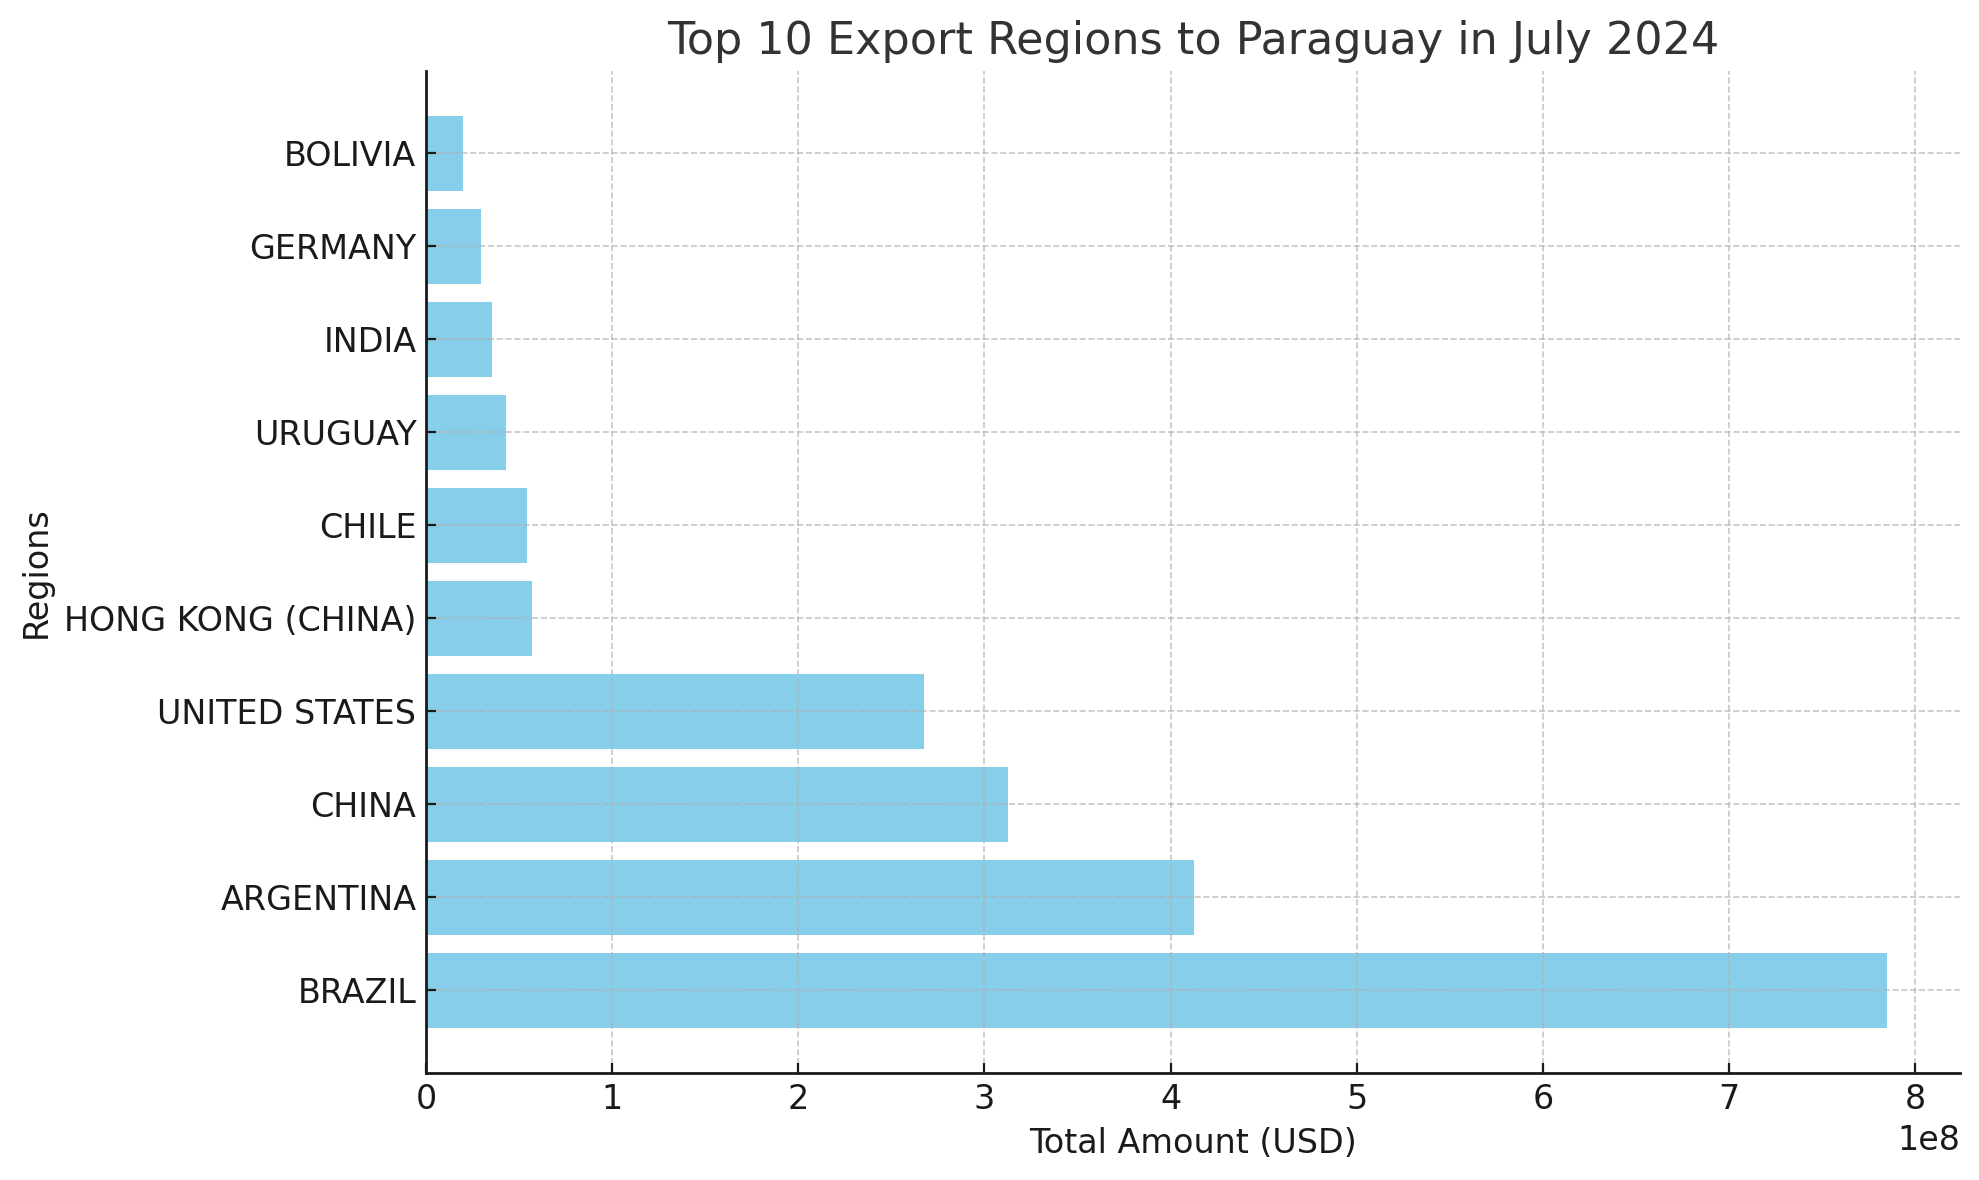
Paraguay’s import activity is strongly influenced by its trade relationships with key regions. The top ten regions exporting to Paraguay in July 2024 are:

  1. Brazil: The leading exporter to Paraguay with $784.97 million worth of goods, a 40.07% increase from June 2024 and a 14.37% rise year-over-year. Brazil’s exports include essential commodities like oil, machinery, and agricultural products.

  2. Argentina: Exports to Paraguay totaled $412.59 million, marking a 17.41% increase month-over-month and a 48.05% year-over-year rise, driven by the trade in foodstuffs and energy products.

  3. China: Imports from China were $312.86 million, a 34.96% increase from the previous month and a 21.87% rise year-over-year. China continues to be a crucial partner, especially in the electronics and machinery sectors.

  4. United States: The U.S. exported $267.66 million worth of goods to Paraguay, a 11.24% increase month-over-month. However, there was an 18.99% decrease year-over-year, indicating a potential shift in trade dynamics.

  5. Hong Kong (China): Exports to Paraguay reached $56.67 million, a 22.63% increase from June 2024 and an impressive 112.00% year-over-year rise, driven by the demand for electronics and communication devices.

  6. Chile: Chilean exports amounted to $54.29 million, a 43.96% month-over-month increase and a 54.89% year-over-year rise, with a focus on agricultural products and consumer goods.

  7. Uruguay: Exports from Uruguay totaled $43.10 million, a 12.96% increase from June 2024. However, there was a 35.16% decrease year-over-year, possibly reflecting changes in trade priorities.

  8. India: Imports from India were $35.16 million, an 86.31% month-over-month increase and a 55.25% year-over-year rise, with pharmaceuticals and textiles being major export items.

  9. Germany: German exports to Paraguay amounted to $29.46 million, marking an 8.93% month-over-month increase and a 27.08% year-over-year rise, focusing on automotive and industrial machinery.

  10. Bolivia: Imports from Bolivia reached $19.98 million, a 12.81% increase from June 2024 and a significant 94.23% year-over-year rise, driven primarily by natural gas and mineral exports.

Conclusion

The July 2024 import data for Paraguay reflects a robust and dynamic trade environment. The country continues to diversify its import sources while meeting the demands of its growing economy. NBD Data remains committed to providing detailed and accurate trade data to help businesses navigate the complexities of international trade.

For more detailed data and insights, please visit NBD Data's official website: en.nbd.ltd.

Related Recommendations

Offer

Hot Topic! 2024 August Philippines Import Data and Market Trends

2024-09-17 16:24:37

The Philippines, as a crucial trade hub in Southeast Asia, has consistently shown a diverse import market. The customs import data for August 2024 reflects the vibrancy of its foreign trade and changing market demands. This report provides an in-depth analysis of these data, examining the types of imported goods, key importers, imports from China, and major trade partners to offer valuable insights for foreign trade professionals.Overview of Philippines Import Data in August 2024:According to the customs data for August 2024, the Philippines recorded a total of 747,215 import entries, a 4.36% decrease from last month's 790,880 entries. Compared to the same period last year, there was a 6.91% increase from 698,913 entries. The total import value reached $11.72 billion, a 4.00% decrease from the previous month’s $12.21 billion but a 3.33% increase compared to $11.34 billion in the same month last year.On the importer side, 21,176 Philippine importers were involved in this month's activities, showing a month-on-month decrease of 1.08% but a year-on-year increase of 2.82%. Regarding suppliers, 54,983 companies supplied goods to the Philippines, with a month-on-month decrease of 5.68% and a year-on-year decrease of 0.35%. These figures indicate that despite a slight decrease in this month’s import activity, the overall trend remains positive, demonstrating the stability and diversity of the Philippine import market.Top Five Imported Goods in the Philippines This Month:Integrated Circuits and Components (HS Code 854239): The total import value this month was $745 million, down 9.19% from the previous month and 10.46% year-on-year. This category is crucial to the electronics industry, and the decline might reflect global supply chain disruptions or changes in the demand for electronics within the Philippines.Crude Oil and Petroleum (HS Code 270900): The import value reached $576 million, with a month-on-month increase of 37.10% and a year-on-year growth of 98.76%, almost doubling. This increase could be linked to international oil price fluctuations and the growing energy demand in the Philippines.Petroleum Products and Lubricants (HS Code 271019): The total import value stood at $531 million, showing a decrease of 6.13% month-on-month and 44.33% year-on-year. The drop in import value could be due to global oil price adjustments, increased use of alternative energy sources, or reduced domestic demand.Petroleum Condensates (HS Code 271012): The import value was $325 million, down 2.51% month-on-month and 25.76% year-on-year. This is related to global oil market fluctuations and adjustments in domestic energy demand in the Philippines.Anthracite (HS Code 270119): The import value was $273 million, slightly down 6.00% month-on-month but up 10.35% year-on-year. This suggests an increase in demand for high-quality fuels in the Philippines, possibly for electricity production and industrial use.Key Importers in the Philippines for Major Goods:In the Philippine import market, some importers have shown outstanding performance in purchasing various categories of goods. Here are the main importers for the top five imported goods this month:Integrated Circuits and Components (HS Code 854239):TI (PHILIPPINES) INC.: $193 million, with a month-on-month increase of $4.23 million.SFA SEMICON PHILIPPINES CORP.: $147 million, with a month-on-month decrease of $49.15 million.ANALOG DEVICES GEN TRIAS INC.: $78.44 million, with a month-on-month increase of $3.34 million.Crude Oil and Petroleum (HS Code 270900):PETRON CORPORATION: $576 million, with a month-on-month increase of $156 million.Petroleum Products and Lubricants (HS Code 271019):PILIPINAS SHELL PETROLEUM CORP.: $128 million, with a month-on-month increase of $2.77 million.UNIOIL PETROLEUM PHILIPPINES INC.: $91.83 million, with a month-on-month increase of $26 million.Petroleum Condensates (HS Code 271012):UNIOIL PETROLEUM PHILIPPINES INC.: $66.84 million, with a month-on-month increase of $12.45 million.J G SUMMIT OLEFINS CORP.: $53.35 million, with a month-on-month increase of $16.19 million.Anthracite (HS Code 270119):GN POWER DINGININ LTD. CO.: $39.89 million, with a month-on-month increase of $15.20 million.Philippines’ Major Trade Partners:China: As the largest trade partner of the Philippines, China's total export value to the Philippines was nearly $3 billion this month. Although there was a month-on-month decrease of $328 million, there was a year-on-year increase of $473 million. This suggests that despite short-term fluctuations, the long-term China-Philippines trade relationship remains on a growth trajectory.Indonesia: Ranking second, the total export value was approximately $1.057 billion, with a month-on-month increase of $82.97 million and a year-on-year increase of $94.99 million, indicating steady growth in trade with the Philippines.Korea: With a total export value of $908 million, Korea experienced a month-on-month increase of $61.15 million and a year-on-year increase of $118 million, showing an upward trend in exports to the Philippines, highlighting the close cooperation between the two countries in goods trade.Japan: Although the export value to the Philippines was around $820 million this month, it saw a month-on-month decrease of $142 million and only a $11.04 million increase year-on-year, indicating potential volatility in Japan-Philippines trade.United States: Ranking fifth with $760 million, showing slight month-on-month growth but a year-on-year decrease of $105 million, possibly due to market demand changes or tariff policy adjustments.Other key trade partners include Thailand, Vietnam, Singapore, Malaysia, and Taiwan (China), with some countries like Vietnam showing significant month-on-month growth.Philippines Exchange Rate Trend:Over the past 12 months, the Philippine Peso to USD exchange rate has shown an overall upward trend. From 56.82 in September 2023 to 57.24 in August 2024, this fluctuation indicates a relative depreciation of the Peso against the USD. This trend may be influenced by global market changes, the Philippine economic environment, and international trade conditions.Conclusion:The August 2024 customs data of the Philippines reveals changes in various import sectors. The demand for goods like integrated circuits, petroleum products, and motor vehicles highlights the ongoing development in the Philippines' manufacturing, technology, and consumer markets. The variety and significant value of goods imported from China reflect the deepening China-Philippines trade relationship.Major trade partners like China, Indonesia, Korea, and Japan underscore the Philippines' close trade connections with East and Southeast Asia. Meanwhile, the upward trend in the Peso's exchange rate against the USD poses new challenges for importers regarding costs and pricing strategies.Disclaimer: The data and analysis in this report are derived from NBD Data's statistical results and may contain some errors. Users should verify these data independently. NBD Data is not responsible for any consequences arising from the use of this report's information.For more detailed data, please visit NBD Data's official website: en.nbd.ltd...

Offer

Comprehensive Analysis of India’s July 2024 Import Data

2024-08-28 13:18:20

In July 2024, India’s import data revealed significant trends and shifts across various sectors. Leveraging our expertise at NBD Data, we provide a detailed analysis of these trends, using our comprehensive customs data services. This report will cover key import categories, trade relationships, and future predictions based on year-over-year (YoY) and month-over-month (MoM) data changes.1. Overall Import Data OverviewIn July 2024, the total number of import records for India stood at 5,412,231, marking a decrease of 21.55% compared to the previous month and a YoY decline of 25.31%. Despite this decrease in the number of records, the total import value reached $79.92 billion, representing a MoM increase of 50.00% and a YoY growth of 48.57%. The data also shows a slight increase in the number of buyers and suppliers, reflecting sustained activity in the Indian market.2. Analysis of Key Import Categories and PredictionsThe top five import categories for India in July 2024 are as follows:HS Code 270900: Petroleum and its products – Import value: $19.22 billion, MoM growth of 97.55%, and YoY growth of 71.47%. The significant rise in petroleum imports underscores India's growing energy demands. Given the volatile nature of global oil prices and India’s heavy reliance on imports, we anticipate continued high levels of petroleum imports in the coming months.HS Code 270119: Coal and coal products – Import value: $3.77 billion, MoM growth of 63.93%, and YoY growth of 65.53%. The demand for coal remains robust, driven by India's energy requirements. However, as the country transitions towards renewable energy, the growth rate may moderate in the future.HS Code 710812: Precious metals and related products – Import value: $3.18 billion, MoM growth of 19.82%, and YoY growth of 41.05%. The appetite for precious metals, often seen as a safe investment, is likely to persist amidst global economic uncertainties.HS Code 151110: Edible vegetable oils – Import value: $1.94 billion, MoM growth of 81.81%, and YoY growth of 74.05%. With rising domestic demand for food products, we expect stable growth in this category.HS Code 854231: Semiconductors and electronic components – Import value: $1.60 billion, MoM growth of 20.89%, and YoY growth of 34.34%. As the digital economy expands, the demand for semiconductors is predicted to increase, driving further imports in this category.These categories indicate strong demand in the energy and technology sectors, reflecting broader global trends. We predict continued growth in these sectors, particularly in technology-related imports, as India accelerates its digital transformation.3. Imports from the United States: Key Categories and TrendsFocusing on India’s imports from the United States, the top five product categories in July 2024 were:HS Code 270900: Petroleum and its products – Total value: $584.31 million, MoM growth of 295.27%, but with a slight YoY decrease of -0.13%. This category continues to dominate due to the ongoing energy needs.HS Code 270119: Coal and coal products – Total value: $507.72 million, MoM growth of 310.23%, and YoY growth of 78.90%.HS Code 270799: Other mineral fuels – Total value: $326.52 million, MoM growth of 155.88%, and YoY growth of 110.10%.HS Code 841112: Turbojets and turbopropellers – Total value: $202.16 million, MoM growth of 89.96%, though with a YoY decrease of -51.47%.HS Code 220720: Ethyl alcohol and other spirits – Total value: $150.70 million, MoM growth of 421.96%, and YoY growth of 644.25%.The data suggests a strong focus on energy-related products and specialized machinery. Given the strategic partnership between the U.S. and India, these categories are likely to see sustained growth.4. Top 10 Trade Regions Exporting to IndiaThe top 10 regions exporting to India in July 2024 are:These numbers highlight India’s diverse import relationships, with China, Russia, and the United States being the largest contributors. The high growth rates from regions like Russia and Saudi Arabia emphasize the importance of these trade relationships in meeting India’s growing demands.ConclusionThe analysis of India’s July 2024 import data reveals dynamic shifts and strong growth across several key sectors. NBD Data continues to monitor these trends closely, providing actionable insights to help businesses navigate the evolving trade landscape.Disclaimer: The data and analysis in this report are derived from NBD Data's statistical results and may contain some errors. Users should verify these data independently. NBD Data is not responsible for any consequences arising from the use of this report's information....

Offer

Uruguay Customs Import Data Update - July 2024

2024-08-09 15:42:48

I. Overall Data OverviewIn July 2024, Uruguay's import activities demonstrated significant growth, reflecting the country's robust demand in the global supply chain. Despite a 13.78% month-on-month decrease in the total number of import records and a 10.55% year-on-year decrease, the total import value surged. The total import value for this month reached USD 1.89 billion, representing a 21.73% increase from the previous month and an 11.81% increase compared to the same period last year. This growth indicates strong demand for high-value goods in Uruguay.The number of active buyers also increased this month, reaching 5,467, a rise of 8.09% month-on-month and 6.67% year-on-year. This data suggests a more dynamic market with increased participation from various enterprises.II. Top 5 Imported Product CategoriesUruguay's top five imported product categories in July 2024 showed diverse demand across different sectors:HS Code 470329 - Other Pulp: The total import value for this category was USD 180.78 million, marking a 50.58% month-on-month increase and a 60.21% year-on-year increase. This significant growth underscores the strong demand for raw materials in Uruguay's industrial sector.HS Code 271600 - Electrical Energy Products: This category maintained a stable import value of USD 112 million, with no month-on-month change but a substantial 47.37% year-on-year increase. This stability reflects Uruguay's ongoing investments in energy supplies.HS Code 270900 - Crude Oil and Petroleum Products: The total import value for this category was USD 87.06 million. Despite having no import data for the previous month, this category saw a 12.67% year-on-year increase, indicating continued demand for petroleum in Uruguay.HS Code 300490 - Pharmaceutical Products: This category saw an import value of USD 52.11 million, with a 35.99% month-on-month increase but a 4.72% year-on-year decrease. This fluctuation reflects the dynamic nature of the pharmaceutical market.HS Code 330210 - Fragrances and Flavors: The import value for this category was USD 42.22 million, with a 4.47% month-on-month decrease but a 3.52% year-on-year increase, suggesting a stable demand for fragrance products.III. Top 5 Products Imported from the United StatesThe following are the top five product categories imported from the United States to Uruguay:HS Code 330300 - Perfume and Cosmetics: The total import value for this category was USD 5.21 million, reflecting a 5.10% month-on-month decrease and a 13.88% year-on-year decrease. Despite these declines, cosmetics remain a key import from the U.S.HS Code 852872 - Television Receivers: This category experienced a significant month-on-month increase of 120.23% and a 156.87% year-on-year increase, with a total import value of USD 3.75 million. The strong demand for electronics is evident in these figures.HS Code 841510 - Air Conditioning Machines: The import value for this category was USD 1.40 million, showing a remarkable 707.08% month-on-month increase and a 519.70% year-on-year increase. The surge in demand for air conditioning units is particularly noteworthy.HS Code 220830 - Whisky: This category saw a total import value of USD 1.21 million, reflecting a 22.43% month-on-month decrease and a 25.90% year-on-year decrease. The decline may suggest changes in consumer preferences or market conditions.HS Code 220421 - Wine: The total import value for wine was USD 1.01 million, with a 140.91% month-on-month decrease and a 29.42% year-on-year decrease, indicating a significant drop in wine imports.IV. Top 10 Trade Regions Exporting to UruguayUruguay's import sources were diverse, with the top 10 regions contributing significantly to the overall import value:Uruguay (Domestic Imports): Totaling USD 483.12 million, this category saw a 23.49% month-on-month increase and a 10.80% year-on-year increase, indicating a strong internal trade flow.Brazil: Imports from Brazil reached USD 374.25 million, with a 17.56% month-on-month increase and a 26.17% year-on-year increase, reflecting robust trade ties.China: Imports from China amounted to USD 221.76 million, with a 36.48% month-on-month increase and a 50.38% year-on-year increase, highlighting China's growing importance as a trade partner.Argentina: Argentina's exports to Uruguay totaled USD 178.82 million, showing a 16.25% month-on-month increase but a 19.63% year-on-year decrease, suggesting possible shifts in trade dynamics.Turkey: Imports from Turkey surged to USD 95.29 million, a staggering 1027.28% month-on-month increase and a 590.25% year-on-year increase, indicating a dramatic rise in trade activity.Unknown: Imports from unknown regions totaled USD 92.03 million, with a 13.46% month-on-month increase and a 19.86% year-on-year increase, reflecting growing trade from less defined regions.Paraguay: Imports from Paraguay reached USD 48.17 million, with a 37.44% month-on-month increase but a 17.96% year-on-year decrease, showing mixed trends.Mexico: Imports from Mexico totaled USD 38.49 million, a 17.24% month-on-month decrease but a 4.03% year-on-year increase, indicating moderate trade activity.United States: Imports from the U.S. amounted to USD 30.41 million, with a 21.76% month-on-month increase and a 19.96% year-on-year increase, maintaining the U.S.'s strong trade presence.Germany: Imports from Germany totaled USD 22.22 million, with a 3.70% month-on-month decrease and a 13.69% year-on-year decrease, reflecting a decline in trade with Germany.ConclusionUruguay's import activity in July 2024 showed strong growth, particularly in high-value product categories such as energy products, pharmaceuticals, and automotive components. The data suggests that Uruguay's demand for essential goods and advanced technologies remains strong. NBD Data will continue to monitor global market trends to provide the most accurate and up-to-date customs data analysis to help businesses capitalize on emerging opportunities.Disclaimer: The data and analysis in this report are derived from NBD Data's statistical results and may contain some errors. Users should verify these data independently. NBD Data is not responsible for any consequences arising from the use of this report's information.For more detailed information, please visit NBD Data's official website....