Resilient Growth in India’s Rubber Seal Market: Analyzing O-Ring Imports and Global Supply Trends

Publishing Date:2025-11-14 14:55:16 Source: NBD Data(en.nbd.ltd)

From January to June 2025, India’s import market for O-Rings (HS Code 40169320) showed strong resilience and steady growth. O-Rings, though small, are vital sealing components used in automotive, machinery, aerospace, and energy applications. According to NBD DATA, India imported over 433.6 million O-Rings worth USD 22.31 million during the first half of 2025.

This continuous growth reflects India’s expanding industrial base and its deepening integration into global manufacturing supply chains. The trade involved 63 exporting countries, with 1,866 Indian importers and 2,846 foreign suppliers actively participating in the market.

Import Trends: Quantities and Trade Dynamics

Between January and June 2025, India’s O-Ring imports maintained a consistent upward trajectory. The highest import values were recorded in May (USD 4.21 million) and March (USD 4.10 million), while the total import quantity exceeded 430 million units in just six months.

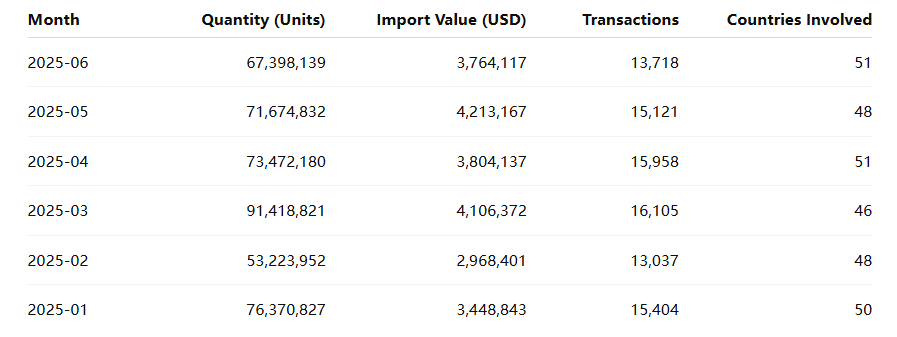
Import activity was stable throughout the half-year period. March recorded the largest quantity (91.4 million units), while May reached the highest total value, indicating demand for higher-specification O-Rings.

The rising import volume suggests growing use of imported seals in India’s automotive manufacturing, precision equipment, and engineering maintenance sectors.

Key Importers and Market Leaders

India’s O-Ring market is characterized by a mix of multinational subsidiaries and leading domestic industrial players. The top importers include:

1. GMORS India Pvt. Ltd.

As a subsidiary of Taiwan’s GE MAO RUBBER INDUSTRIAL CO., LTD., GMORS India led the O-Ring import segment with over 43 million units, totaling USD 729,948. Most imports came from Taiwan(China) and Thailand, supplied by GE MAO RUBBER INTERNATIONAL (Thailand) Co., Ltd. and Applied Seals Co., Ltd.. These O-Rings are used in automotive systems and industrial sealing applications requiring oil and heat resistance.

2. Trelleborg India Private Limited

Sweden’s Trelleborg Group, through its Indian subsidiary, imported approximately 15.5 million O-Rings valued at USD 800,000. Key suppliers included Trelleborg Sealing Solutions Germany GmbH and Trelleborg UK Ltd.. These products are used in high-performance sectors such as aerospace, medical devices, and precision machinery.

3. Komatsu India Private Limited

Komatsu India imported about 512,000 units worth USD 146,784, mainly from Japan’s Komatsu Ltd., Komatsu Logistics Corp., and Goh Shoji Co., Inc. The demand reflects India’s steady investment in construction and mining equipment production.

4. Tata Hitachi Construction Machinery Co. Pvt. Ltd.

Tata Hitachi imported around 389,000 units, valued at USD 122,318, from Hitachi Construction Machinery (Japan) and related subsidiaries. These O-Rings are primarily used in hydraulic systems and excavator assembly lines.

5. Horiba India Private Limited

Horiba India, a leading scientific equipment manufacturer, imported 9,211 units of precision sealing products worth USD 27,809 from Horiba Techno Service Co., Ltd. (Japan) and Horiba Instruments Inc. (U.S.). These are used in analytical and measuring instruments requiring airtight performance.

Major Global Suppliers

India’s O-Ring imports are supported by a wide network of global suppliers, particularly from Asia and Europe:

These suppliers provide O-Rings for various applications — from heavy machinery and compressors to food and energy equipment — ensuring that India’s manufacturing ecosystem remains globally competitive.

Trade Regions and Global Integration

India’s O-Ring imports originated from 63 countries, demonstrating a high level of trade diversification.
The main sourcing regions were:

  1. East Asia (Taiwan(China), Japan, China) – Automotive and industrial-grade O-Rings

  2. Europe (Germany, Sweden, UK) – High-precision and aerospace sealing systems

  3. ASEAN & South Korea – General-purpose rubber seals

  4. North America (U.S., Canada) – Specialty elastomers and advanced sealing materials

This geographic distribution illustrates India’s dual strategy: sourcing high-quality O-Rings from developed markets while maintaining cost efficiency through Asian regional suppliers.

Market Insights and Industrial Implications

The O-Ring import pattern reflects India’s broader industrial transformation:

  • Industrial Modernization: The shift toward automation and precision machinery has boosted demand for high-performance sealing components.

  • OEM Integration: Companies such as Komatsu, Trelleborg, and GMORS integrate imported O-Rings directly into assembly lines, enhancing reliability and consistency.

  • Supply Chain Resilience: With nearly 3,000 exporters and 1,800 importers, India’s supply network remains diversified and competitive.

Additionally, the automotive and electronics industries are expected to further increase O-Ring demand, particularly for heat- and chemical-resistant materials.

Conclusion

India’s O-Ring imports in the first half of 2025 highlight its strong industrial momentum and integration within global manufacturing systems. Importing over 430 million units in just six months shows how critical these small components are to modern production.

From construction machinery and vehicles to analytical equipment and automation, O-Rings play an essential role in ensuring efficiency and reliability.
As analyzed by NBD DATA, global suppliers such as GMORS, Trelleborg, and GE MAO Rubber continue to anchor India’s supply chain, enabling technological advancement and production stability across industries.

Data Source

All trade data and analysis are based on India’s customs records for January–June 2025, processed by NBD DATA. For in-depth enterprise and trade insights, visit NBD DATA Service.

Related Recommendations

Offer

Analyzing India’s Spring Imports in 2025: Trade Flows, Top Buyers, and Regional Insights

2026-01-26 14:22:52

Springs, categorized under HS code73209090, play a crucial role in India’s industrial manufacturing chain, covering sectors from automotive and heavy machinery to electronics and oilfield equipment. As 2025 progressed, India’s import data for SPRINGreflected both the country’s expanding industrial demand and its reliance on globally specialized suppliers. According to trade intelligence from NBD DATA, India’s imports of mechanical springs continued to demonstrate strong growth in both value and shipment frequency.Market OverviewIn 2025, India imported a total of 91,744 spring shipments, valued at USD 71.86 million, involving 3,000 importers, 5,334 exporters, and 71 trading countries. The imported volume reached nearly 957 million units, with an aggregate weight of about 1.03 million kg. This high level of trade activity underscores India’s strong industrial consumption capacity and the continued integration of its manufacturing sector into the global component supply network.Common imported product types included:Valve and compression springs for automotive and machinery applications.Retaining and locking springs used in control valves and industrial fittings.Air springs and torsion springs for suspension and vibration control.Precision coil and disc springs for electronic assemblies and energy equipment.Sample imports recorded in NBD’s dataset include:“VALVE SPRING V12K PART NO 7618835”, “AIR SPRING ASSY 24C7201”, and “SPARE PARTS FOR FILLING MACHINES COMPRESSION SPRING 2522235 0000”, reflecting diverse mechanical use cases.Monthly Import PerformanceThroughout 2025, India’s spring import activity showed steady momentum, with a moderate seasonal peak during the second and third quarters — aligning with fiscal restocking and industrial production cycles.The value trend indicates consistent import levels, with May to July representing the most active phase. This reflects India’s mid-year production surge in automotive and mechanical assembly sectors.Market Observation: Key Importers and SuppliersTop Indian Importers of Springs (HS 73209090)SCHAEFFLER INDIA LIMITED– USD 5.57 millionFIBRO INDIA PRECISION PRODUCTS PRIVATE LIMITED– USD 1.84 millionHYOSUNG T & D INDIA PRIVATE LIMITED– USD 0.84 millionLESER INDIA PVT LTD– USD 0.65 millionTETRA PAK INDIA PRIVATE LIMITED– USD 0.32 millionThese leading Indian companies reflect diverse end-use industries. Schaeffler India supplies precision components to automotive and industrial systems, while Fibro India and Hyosung T&D specialize in manufacturing automation and power equipment. The presence of Leser India and Tetra Pak India emphasizes the import of springs for valves, packaging machinery, and process equipment — critical for the food, beverage, and energy sectors.Top Global Suppliers to IndiaSTROMSHOLMEN AB(Sweden) – USD 1.83 millionDENSO CORPORATION(Japan) – USD 1.43 millionAISIN CORPORATION(Japan) – USD 0.47 millionLESER GMBH & CO KG(Germany) – USD 0.59 millionM S SPECIAL SPRINGS S R L(Italy) – USD 0.34 millionGlobal supply leadership remains with high-precision European and Japanese manufacturers, indicating that India’s import preference tilts toward technologically advanced products used in automotive systems, compressors, and industrial machinery.Regional Trade DistributionIndia’s imports of springs during 2025 were sourced from 71 countries, reflecting a wide-reaching supply chain.The top contributors by shipment and value were as follows:China leads by shipment count, primarily serving India’s demand for mid-tier and low-cost automotive and industrial springs. Germany and Japan, however, account for higher per-unit value due to advanced manufacturing standards. The United States maintains relevance in oilfield and aerospace-grade spring exports. Italy and Sweden supply high-end industrial springs used in hydraulic and process systems.This diversified structure ensures resilience in India’s import supply chain, minimizing dependency on any single source market.Regional Focus: Trade with ChinaIn India’s 2025 spring imports, China remained the most frequent trading partner. With over 21,000 shipments, Chinese manufacturers supplied a significant portion of standard mechanical and precision springs used in machinery, electronics, and vehicles. The price-performance ratio from Chinese suppliers continues to attract Indian SMEs, especially those in Tier 2 and Tier 3 manufacturing clusters such as Pune, Ahmedabad, and Coimbatore.However, India’s sustained trade with Germany, Japan, and the U.S. indicates a dual sourcing strategy: importing cost-efficient items from Asia and high-specification parts from Europe and North America.Industrial InterpretationThe 2025 data highlights India’s strong industrial rebound, reflected by the high import frequency of precision and heavy-duty springs. Several macro trends can be inferred:Manufacturing Expansion – Consistent monthly imports reveal growing demand in India’s automotive and machinery production sectors.Technological Upgrade – Imports from advanced economies suggest increasing adoption of high-performance mechanical components.Supply Chain Diversification – India sources from 70+ countries, mitigating risk amid shifting global logistics.Investment Correlation – Foreign Direct Investment (FDI) in manufacturing complements the steady inflow of critical mechanical components like springs.ConclusionIndia’s import performance under HS 73209090 illustrates a balanced combination of cost efficiency and technology-driven sourcing. The USD 71.86 million trade value for 2025 confirms the importance of springs in sustaining industrial productivity and assembly-line operations across sectors. With 5,334 exporters and 3,000 importers, the ecosystem reflects a competitive, globalized market environment.Going forward, India is expected to retain a strong import flow of springs to support its expanding automotive, energy, and manufacturing sectors. At the same time, localized production will likely rise under the “Make in India” initiative, gradually reducing dependency on imports for standardized components while maintaining imports for advanced technologies.Data SourceAll quantitative data and trade intelligence in this report are based on 2025 import records from NBD DATA, processed through its verified trade database.For deeper analytics or enterprise-level data services, please visit the NBD DATA Service Portal....

Offer

Indonesia’s Women’s Pants Exports Reached 100 Thousand USD in 2024

2026-01-26 11:39:43

In 2024, Indonesia exported women’s trousers and similar woven garments under HS Code 62046200, with a total export value of USD 100,320. These shipments—listed under WOMEN PANT in customs data—show Indonesia’s ongoing role as a key player in global apparel manufacturing, particularly for mid-range and specialized fashion orders.According to NBD DATA, exports reached 14 destination countries, involving 30 exporters and 18 importers. Despite the small trade value, the data highlight Indonesia’s flexibility in fulfilling diverse, small-batch production for international brands and private labels.Quarterly Export OverviewExports of women’s trousers from Indonesia in 2024 displayed a strong seasonal pattern, with peaks in Q1 and Q4, aligning with international production and fashion cycles.Q4 2024 was the most active period, accounting for 43% of total annual exports, as overseas retailers increased orders before the year-end fashion season.Meanwhile, Q3 saw stable shipments supporting autumn inventory cycles, while Q1 recorded early-year production deliveries to long-term clients in Asia and North America.Overall, Indonesia exported approximately 9,403 pieces of women’s pants throughout 2024, averaging USD 10.7 per piece.Key Exporters and Industrial InsightsIndonesia’s women’s pants exports were led by several internationally recognized garment manufacturers:PT. TAINAN ENTERPRISES INDONESIA – A subsidiary of Tainan Group, specializing in high-quality woven trousers for global retail brands, contributing significantly to Indonesia’s export base.PT ANDALAN MANDIRI BUSANA – A key player in tailored apparel, producing for mid-tier labels and private collections.PT. CITRA ABADI SEJATI – Exported garments for international names such as L.L. Bean, known for compliance with ethical and environmental standards.UNGARAN SARI GARMENTS – Focused on precision garment making and small-volume premium orders.SANDANG ASIA MAJU ABADI – Exported USD 98,671 worth of women’s pants in partnership with ASMARA INTERNATIONAL LIMITED, serving European markets.These enterprises highlight Indonesia’s strengths in quality control, flexible production, and export reliability, particularly for small and medium orders. Most are located in Java’s garment clusters, benefiting from established industrial infrastructure and skilled labor.Global Market DistributionIndonesia’s women’s trouser exports reached 14 countries in 2024, primarily destined for the United States, Japan, and Europe (notably Germany and France).Smaller consignments were shipped to Singapore, Malaysia, and Australia, supporting regional fashion retailers through ASEAN trade channels.This export model emphasizes adaptability—serving niche and private-label fashion brands that prefer multiple styles in smaller quantities rather than mass production.Indonesia’s flexible manufacturing model continues to distinguish it from competitors like China and Bangladesh, particularly in mid- to high-quality garment segments.Outlook for 2025Looking ahead, Indonesia’s women’s apparel exports are expected to remain stable or slightly increase as global retailers maintain demand for flexible, small-batch production.The rise of e-commerce brands and fast-response supply chains continues to benefit Indonesian manufacturers that can offer shorter lead times and customized orders.Challenges such as logistics costs and labor adjustments may persist, but innovation through automation, sustainable materials, and digital design is expected to strengthen Indonesia’s export competitiveness.Overall, 2025 is likely to bring continued resilience for Indonesia’s women’s pants sector, with stable trade performance and gradual value growth.Data SourceAll figures and corporate data are based on verified customs trade records analyzed by NBD DATA.For in-depth trade analytics, buyer–supplier mapping, and global apparel trend insights, please visit:https://en.nbd.ltd/service...

Offer

Fashion Retailers Drive Uruguay’s Sweater Import Market in 2025

2026-01-26 11:18:02

In 2025, Uruguay’s import market for knitted sweaters, pullovers, cardigans, and similar garments under HS Code 6110300010 demonstrated steady expansion, reaching a total import value of USD 24.47 million. These products—mainly described as SUETERES (JERSEYS), PULOVERES, CARDIGAN, and CHALECOS—reflect the growing appetite of Uruguayan consumers for warm, fashionable knitwear suited to both formal and casual occasions. According to data compiled by NBD DATA, 490 importers sourced from 44 countries, signaling a robust, diversified supply structure anchored in global fashion supply chains.Leading global retail groups such as ZARA, H&M, and Lolita S.A. played pivotal roles in shaping the import structure. Their operational scale, trend sensitivity, and efficient logistics channels helped Uruguay align with broader South American retail trends. The mid-price segment remained dominant, driven by fashion-conscious urban consumers seeking affordable yet stylish apparel.Monthly Trend OverviewMonthly data reveal clear seasonality in Uruguay’s sweater imports. Trade volume surged in February 2025, ahead of the autumn-winter retail season, with sustained inflows through the first half of the year and a moderate rise again toward December.Imports peaked in February, when shipments exceeded 465 tons, followed by a second-highest level in March. The period from May to September saw moderate import volumes as retailers transitioned between collections. By December, the total weight climbed again, preparing for the summer season and year-end retail promotions.Across 2025, Uruguay imported approximately 2,387 tons of sweaters and cardigans, reflecting stable supply and balanced demand throughout the year.Market Observation: Key Importers and Retail DynamicsUruguay’s knitwear imports were led by established retail chains closely tied to global apparel brands. The major importers included:LOJAS RENNER URUGUAY S.A. — Among the most active importers, managing 2,656 shipments valued at about USD 913 thousand.G.ZARA URUGUAY S.A. — The top importer by value (USD 2.16 million), focused on fast-fashion knitwear collections aligned with Inditex’s global product cycles.HENNES & MAURITZ URUGUAY S.A. — Imported USD 756 thousand worth of sweaters, emphasizing responsive sourcing and sustainability within its distribution model.LOLITA S A — A local fashion brand importing USD 1.39 million in knitwear for domestic retail expansion.UNILAM S A — Ranked among top importers with USD 2.69 million, maintaining consistent volume and diversified sourcing channels.Together, these companies accounted for a substantial share of total imports, highlighting Uruguay’s retail-oriented market structure. The integration of global logistics networks and digital inventory management has allowed these firms to synchronize stock levels with fast-changing consumer demand.Regional Trade FocusUruguay’s sweater imports in 2025 were mainly supplied by China, which continued to dominate the market due to its cost efficiency, product diversity, and speed of fulfillment. Bangladesh, Turkey, and Portugal followed as secondary sources, serving specific fashion and material niches such as wool blends and organic cotton lines.China’s sustained leadership underscores its adaptability to small and mid-sized Latin American markets, supplying both volume and design flexibility. Meanwhile, European exporters catered to higher-end retail and boutique segments, offering knitwear distinguished by quality craftsmanship and limited editions.Market Outlook for 2026The outlook for 2026 remains cautiously optimistic. Retail sales in Uruguay are projected to continue growing, supported by recovering household consumption and expanding e-commerce channels. The ongoing shift toward online and omnichannel models will further shape import patterns, emphasizing faster delivery and smaller, more frequent shipments.However, potential challenges include logistical costs and currency volatility, which could influence import pricing. Retailers are expected to respond by reinforcing partnerships with established suppliers in Asia and South America to maintain product flow and cost efficiency.Overall, the 2025 trade data reveal a resilient, fashion-driven market structure. Uruguay’s sweater imports will likely sustain steady growth, supported by consumer demand for accessible, quality knitwear and by the operational strength of leading global retailers.Data SourceAll trade statistics and company information are based on verified customs data processed and analyzed by NBD DATA.For enterprise-level access to detailed transaction records, supply chain maps, and long-term trend analytics, please visit:https://en.nbd.ltd/service...