Ethiopia’s Imports Edge Higher in April 2025, Fueled by Energy and Transport Sectors

Publishing Date:2025-05-10 16:20:59 Source: NBD Data(en.nbd.ltd)

Ethiopia's external trade activity exhibited modest but steady growth in April 2025. The country imported goods worth $1.60 billion, representing a month-over-month increase of 1.77% from March's $1.57 billion. This performance, based on 24,071 recorded transactions, points to a cautiously expanding import landscape, supported primarily by critical sectors such as petroleum and logistics.

Over the past six months, Ethiopia’s import volume has fluctuated within a notable range. Following a sharp dip in February 2025 ($1.29 billion), the country quickly rebounded to levels above $1.5 billion in March and April, suggesting a short-lived contraction. Company participation remained stable during this period, with April witnessing 3,837 Ethiopian importers, only slightly down from the prior month. Meanwhile, the overall record count declined—indicating either larger consolidated transactions or reduced variety in imported commodities.

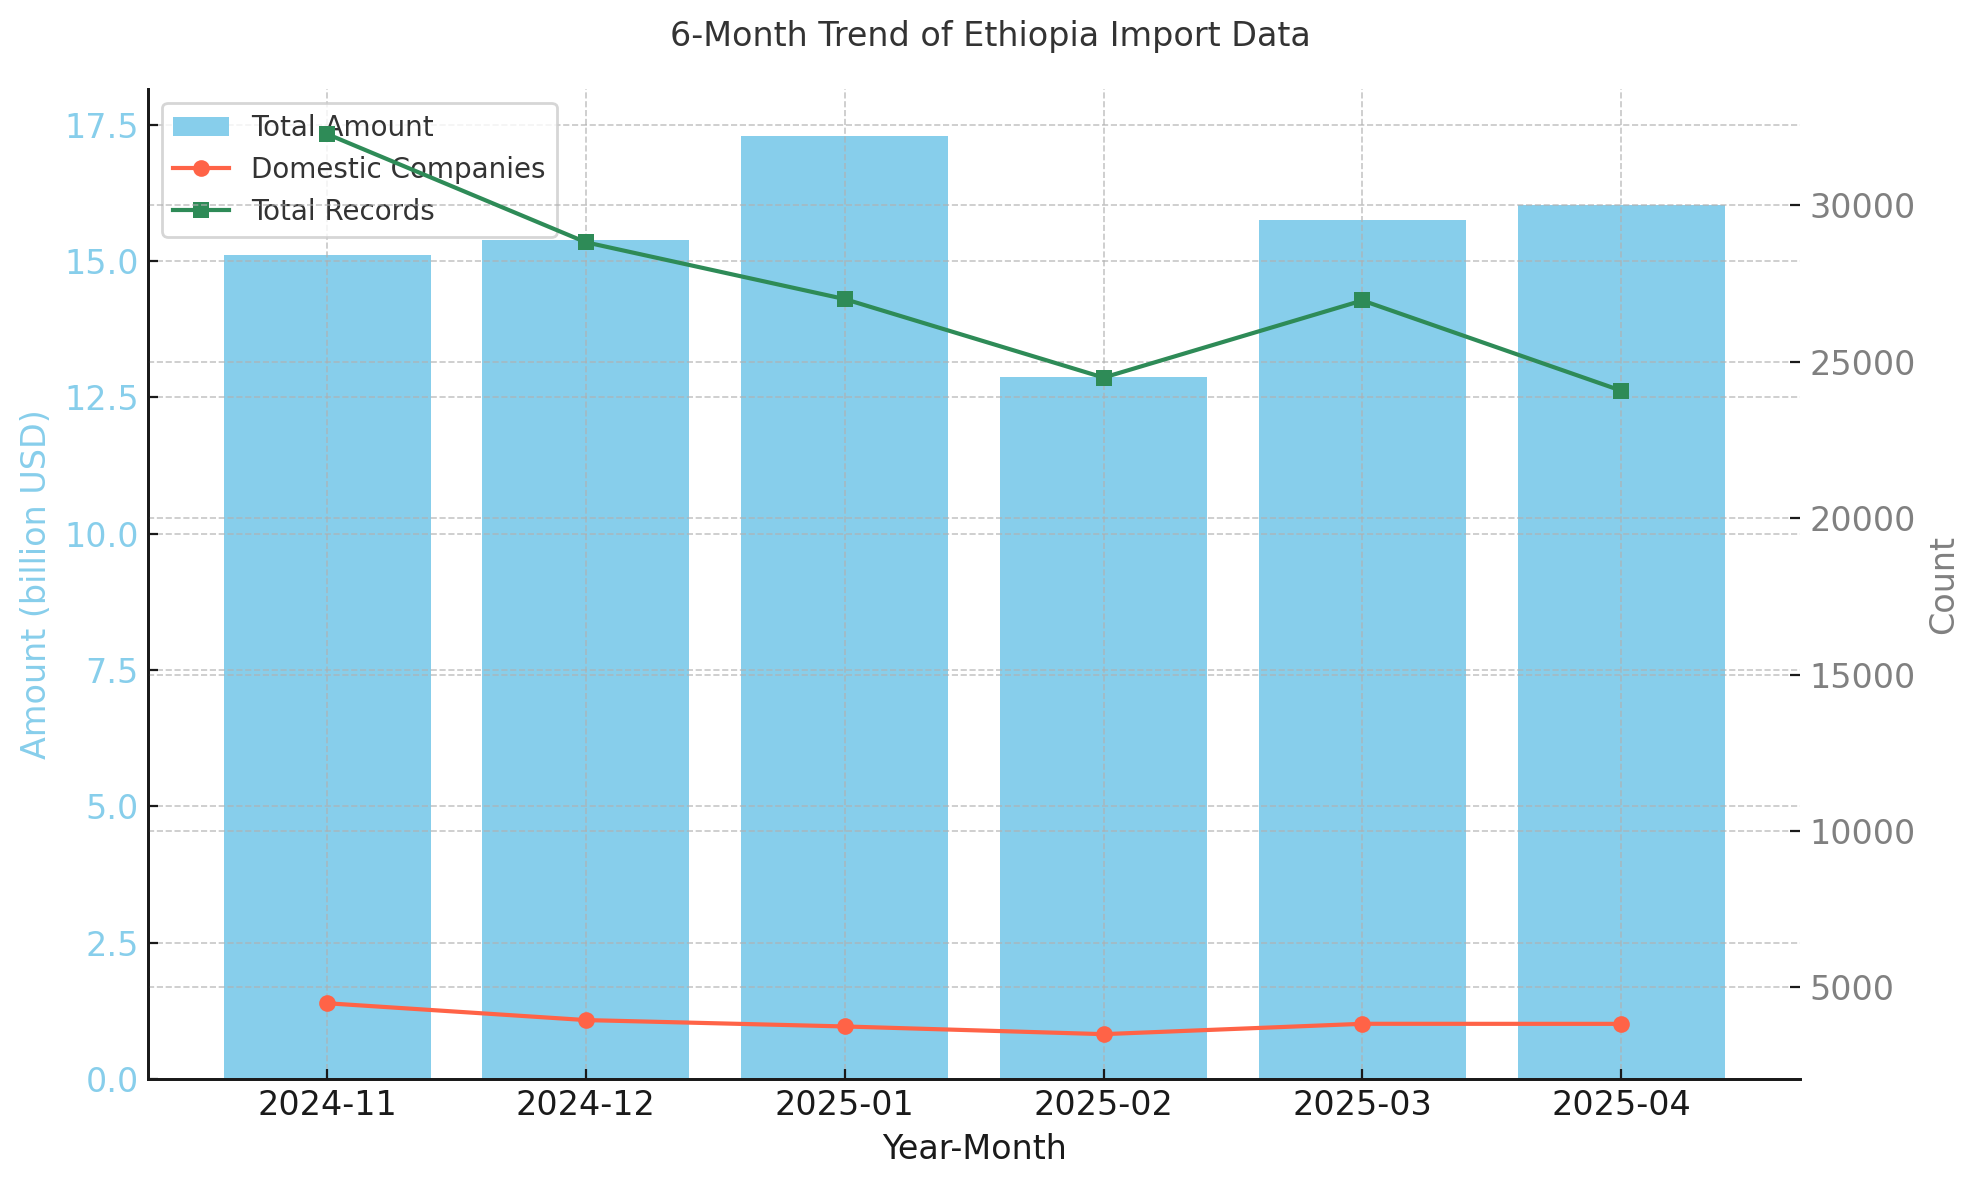
Bilateral Trade: A Concentrated Matrix of Influence

The distribution of Ethiopia’s top import partners in April underscores a highly asymmetrical structure. China led all trade counterparts with $399 million in exports to Ethiopia, servicing 1,766 domestic buyers across 1,806 product categories. This confirms China’s expansive footprint in Ethiopia's industrial, consumer, and infrastructure-related imports.

Djibouti ranked second with $323 million, likely reflecting continued reliance on the Red Sea gateway for port and transit services, rather than diversified goods per se. Kuwait and Saudi Arabia, with $245 million and $210 million respectively, primarily fulfilled Ethiopia’s critical demand for refined petroleum products. Notably, Kuwait’s trade contribution was driven by a single transaction class with a lone importer and supplier—an archetype of bulk energy trade.

Further down the list, India ($68 million), the UAE ($49 million), and Jordan ($41 million) contributed through a more varied range of goods, such as processed foods, chemicals, and light machinery. The United States, Hong Kong SAR, and Indonesia each recorded smaller volumes under $30 million, but their involvement reflects Ethiopia’s growing links to global supply chains across different commodity clusters.

Surge from Unexpected Quarters: Emerging Trade Contributors

A more dynamic story unfolds when examining growth rates. Ukraine’s import value skyrocketed from a negligible $236 in March to over $12 million in April, an astronomical leap of over 5.1 million percent. While this change is clearly anchored in a low base effect, it hints at the initiation of a new trade corridor—perhaps in agricultural inputs or defense logistics.

Slovakia, Australia, Ireland, and Canada also posted triple- and quadruple-digit growth rates, ranging from 727% to over 4,700%. Canada, with $11.7 million in exports to Ethiopia, appears to be reasserting itself as a mid-tier supplier, possibly in sectors such as agri-tech, transportation, or pharmaceuticals.

Commodity Dynamics: Fuels and Functional Goods Dominate

From a product standpoint, refined petroleum oils (HS 271020) dominated the import ledger with $448 million in value—a 160% increase over March. The Ethiopian Petroleum Supply Enterprise alone accounted for $447 million, reaffirming the centrality of public energy procurement. Two smaller importers, MISBAH MAMMA HAJIAMAN and ABDELLA ADEM GUUTAA, also participated, albeit marginally.

Heavy-duty trucks between 5–20 tons (HS 870422) ranked second among fast-growing commodities, with import value increasing by 141%. Primary buyers included BELAYNEH KINDE MEKONNEN, GOLDEN STAR PLC, and ETHIOPIAN AGRICULTURAL BUSINESSES, indicating demand from agribusiness and infrastructure logistics.

Other notable product categories included milled rice (HS 100630), which surged 115% to reach $13.6 million in imports. Key importers like AHMED HUSSEN MOHAMMED, QUDWA BUSINESS PLC, and NAJIB AHMED ALI underline the role of staple grains in food security.

The aviation sector made a substantial entry this month, with HS 880730 accounting for $23 million in aircraft components—up 64%. ETHIOPIAN AIRLINES GROUPwas the dominant acquirer, perhaps linked to maintenance operations or fleet expansion.

Finally, sugarcane derivatives (HS 170114) brought in $27.8 million, registering a 54% growth. Importers such as EAST AFRICA BOTTLING SHARE CO. and YASIN MOHAMMED OUMER emphasize industrial usage in beverages and confectionery.

Conclusion

Ethiopia’s import performance in April 2025 reinforces a broader trend of structural resilience anchored by energy, transport, and essential commodities. While traditional partners such as China and the Gulf states continue to dominate in scale, the emergence of new contributors like Ukraine and Slovakia highlights a diversification of origin markets. With steady volumes and targeted procurement behavior, Ethiopia appears poised to navigate both supply volatility and developmental demand with growing sophistication.

Related Recommendations

Offer

Ecuador’s July 2025 Imports Surge 14.05% to $3.19 Billion, Led by U.S. and China Trade

2025-08-11 17:42:09

In July 2025, Ecuador’s import activity experienced a significant upswing, with total imports reaching $3.19 billion, marking a 14.05% increase compared to $2.80 billion in June. This growth was supported by 1,638,334 transaction records, underscoring strong trade activity and the resilience of the country’s import sector amid evolving global market conditions.Six-Month Trend AnalysisOver the past six months, Ecuador’s import value has demonstrated a steady upward trend, peaking in July after a moderate dip in June. February recorded $2.78 billion in imports, followed by a slight decline in March to $2.68 billion. April and May saw renewed momentum at $2.74 billion and $2.89 billion, respectively, before a drop to $2.80 billion in June. July’s rebound to $3.19 billion coincided with a notable contraction in the number of domestic importers, from 113,403 in June to 65,277 in July, suggesting concentration of larger import transactions among fewer but possibly more capital-intensive companies. Transaction volumes mirrored this contraction, dropping from 1.92 million records in June to 1.64 million in July, indicating a possible shift toward high-value goods.Top 10 Trade PartnersThe United States maintained its position as Ecuador’s top import partner in July, supplying goods worth $829 million. This trade involved 50,738 Ecuadorian importers and 2,744 U.S. suppliers, covering 2,369 product categories, with petroleum products, machinery, and electronics being key sectors.China ranked second with $682 million in imports, driven by high volumes of manufactured goods, industrial machinery, and electronics. A total of 5,389 Ecuadorian importers engaged with 6,020 Chinese suppliers, covering 2,639 categories.Panama followed with $253 million in trade, a notable share given its smaller supplier base of 261 companies serving 1,655 Ecuadorian importers. This reflects Panama’s role as a regional logistics hub for petroleum derivatives and re-exports.Colombia ranked fourth with $183 million, involving 1,721 Ecuadorian importers and 1,297 Colombian suppliers, spread across 1,526 categories, with agricultural commodities and construction materials being prominent.The remaining six partners—Peru, Brazil, Spain, Italy, Chile, and Argentina—collectively contributed a diversified import portfolio exceeding $5.0 billion annually, reflecting strong regional and intercontinental ties.Fastest-Growing Trade PartnersCambodia recorded an unprecedented surge to $55,485 from only $6 last month, reflecting a 890,513.16% growth, likely due to a large one-off shipment in textiles or specialty goods.Myanmar saw imports rise to $7,849, a 1,891.83% jump, suggesting the beginning of small-scale trade channels.Bolivia surged to $16.32 million, up 1,450.33%, largely in minerals and food products.Morocco posted $121,231, up 1,084.70%, possibly linked to increased demand for specialized industrial materials.Kuwait expanded its exports to Ecuador to $34,323, up 882.82%, potentially tied to petrochemical products.Commodity Trends and HS Code AnalysisThe fastest-growing commodity in July was HS 270750Aromatic hydrocarbon mixtures, which surged 122.28% to $220.11 million. Key buyers included EMPRESA PUBLICA DE HIDROCARBUROS DEL ECUADOR EP PETROECUADOR($130.02 million), EMPRESA DE HIDROCARBUROS DEL ECUADOR EP PETROECUADOR($89.86 million), and INDUSTRIAL LATINA S.A..HS 870121(Motor vehicles for the transport of persons, diesel-powered) grew 54.53% to $13.87 million, with major importers such as INDUSUR INDUSTRIAL DEL SUR S. A.and COMERCIAL CARLOS ROLDAN CIA. LTDA..HS 842952(Mechanical shovels, excavators, and shovel loaders with 360° rotation) increased 52.62% to $21.04 million, led by IASA S.A.and DITECA S.A.HS 852872(Color television reception apparatus) rose 50.90% to $15.30 million, with leading buyers including INTELLCARD S.A.and CAR SOUNDVISION CIA. LTDA..HS 390210(Polypropylene in primary forms) grew 50.87% to $12.36 million, with PLASTICSACKS CIA LTDA.and OBEN ECUADOR S.A.among the top buyers.Ecuador’s import sector in July 2025 displayed strong performance, underpinned by surging demand for hydrocarbons, machinery, and consumer electronics. The dominance of the U.S. and China reflects sustained global trade connectivity, while the rise of smaller partners such as Cambodia and Bolivia highlights evolving trade diversification. With energy-related imports leading the surge, Ecuador is positioned for continued trade growth, though the concentration among fewer importers suggests a strategic pivot toward large-scale, high-value transactions....

Offer

May 2025 Trade Snapshot: Colombia’s Imports Rise by 5.87%, Led by U.S. and China

2025-08-01 14:24:07

In May 2025, Colombia's total import value reached $6.13 billion, reflecting a 5.87% increase from April’s $5.79 billion. This uptick was supported by an expansion in trade activity, as the country recorded 331,782 import transactions across the month. The surge also coincided with a rise in active importers, underscoring a robust recovery in demand across key industrial sectors.Over the past six months, Colombia’s import volume demonstrated a steady upward trend, particularly after a dip in early 2025. From December 2024’s $5.65 billion, the figure declined slightly in January and February, followed by consecutive growth through March, April, and May. Notably, the number of domestic import companies climbed from 11,709 in February to 13,205 in May, while the total monthly transaction count increased by over 30,000 entries within the same period. This suggests growing commercial engagement and a diversification in sourcing activity.Among Colombia’s top ten import partners in May 2025, the United States maintained its leading position with $1.747 billion in trade value. A total of 4,258 Colombian importers were active in transactions with the U.S., involving 2,745 suppliers and over 5,700 product categories—a testament to the deep and varied commercial ties, particularly in pharmaceuticals, machinery, and electronics.China ranked second with $913 million in imports. Trade was conducted by 5,809 Colombian companies sourcing from 2,785 Chinese exporters, encompassing over 8,300 distinct product categories, the highest among all partners. This highlights China’s role as a broad-spectrum supplier, especially in consumer electronics and industrial goods.Panama stood out with $341 million in trade, facilitated by 774 Colombian firms and 1,658 Panamanian suppliers. As a strategic transshipment and re-export hub, Panama’s importance lies in its logistical advantage and flexibility across diverse commodity types.Switzerland followed closely with $325 million in imports. Although involving a relatively modest 385 Colombian importers, they engaged with 1,136 Swiss exporters in high-value segments such as chemicals, precision instruments, and medical devices.The remaining six partners—Brazil, Mexico, Germany, Korea, Chile, and even Colombia itself (for intra-national re-importation)—collectively contributed a significant volume of diversified imports. Their combined presence underscores the geographic and sectoral variety in Colombia’s external trade ecosystem.The fastest-growing trade relationships in May were led by Moldova, which recorded a 22,017.78% month-on-month surge, reaching $475,859 from just $2,151 in April. While the absolute figure remains modest, this exponential rise may reflect a new trade channel opening, likely involving agricultural or chemical goods.Croatia and Malta also saw dramatic increases—4,977.76% and 2,777.82% respectively—suggesting emerging niche trade flows or first-time large-volume contracts. Meanwhile, Andorra’s 1,689% surge and Morocco’s significant jump to $3.25 million (+714.16%) reinforce the trend of Colombia tapping into less traditional sourcing markets for specific categories.From a product perspective, urea-based nitrogenous fertilizers (HS Code 310210) topped the growth charts, up 156.48% month-on-month to $41 million. Major importers included PRECISAGRO S.A.S., NITROFERT S.A.S, and ARARAS NUTRICION S A S, reflecting heightened demand in Colombia’s agribusiness sector.In the machinery segment (HS Code 847989), imports surged nearly 100%, led by EMGESA S A ESP, THE ELITE FLOWER SAS C I, and ENERLAND 2007 FOTOVOLTAICA SL, pointing to expansion in energy and automation sectors.Television and video display equipment (HS Code 852872) recorded an 87.11% jump, with top importers such as SAMSUNG ELECTRONICS COLOMBIA S.A., ALKOSTO S.A., and LG ELECTRONICS COL LTDA.responding to rising consumer electronics demand.Pharmaceuticals (HS Code 300215) also grew significantly, with leading firms like ASTRAZENECA COLOMBIA S.A.S., MERCK SHARP AND DOHME COLOMBIA S A S, and PRODS ROCHE S Ashowing strong activity.The most valuable category remained light petroleum oils (HS Code 271012), which rose by 41.99% to a massive $325.9 million. Key importers included ECOPETROL S.A., REFINERIA DE CARTAGENA S.A, and FRONTERA ENERGY COL CORP SUC COL, underscoring continued demand from Colombia’s refining and energy sectors.In conclusion, Colombia’s import performance in May 2025 signals strong momentum, especially in high-value sectors such as energy, electronics, machinery, and agrochemicals. The rise in both volume and diversity of trade partners suggests growing resilience and complexity in the country’s trade structure. Moving forward, continued monitoring of emerging partners and product categories will be key to understanding Colombia’s evolving import dynamics....

Offer

Panama’s Import Performance in June 2025: U.S. and China Lead, Congo Surges

2025-07-30 00:24:43

Panama imported goods worth $1.23 billion in June 2025, reflecting a 4.82% decline from May’s total of $1.29 billion. The number of records filed reached 145,966, and 5,400 domestic importers were active during the period. This moderate month-on-month contraction indicates shifting demand patterns and possible seasonality effects across several key sectors.Over the past six months, Panama’s import value has fluctuated between $1.16 billion and $1.29 billion. January 2025 started strong at $1.26 billion, followed by minor volatility through April. May marked the highest value in the half-year window before June’s decline. The number of domestic importers remained stable, peaking in May with 5,452 active companies. Record volumes followed a similar trajectory, aligning closely with total trade activity.The United States remained Panama’s top trading partner in June, contributing $205 million to the import total. This trade involved 1,840 Panamanian importers and 2,929 U.S. suppliers, with goods spanning 2,276 categories. The U.S. continues to serve as Panama’s key source of industrial, technological, and agricultural products.Close behind was China, with $199 million in imports. 1,927 local buyers sourced from 3,179 Chinese exporters, covering 2,025 product types. This reflects China’s strength in consumer goods, electronics, and intermediate inputs.Mexico took third position at $55 million, with a balanced ecosystem of 485 Panamanian importers and 793 Mexican suppliers, indicating strong regional ties and cost-efficient logistics. Costa Rica followed with $41 million, backed by 308 Panamanian companies trading with 393 Costa Rican partners across 400 goods—a testament to Central American intra-regional trade.Colombia, Spain, Japan, Brazil, and Guatemala rounded out the top ten. Collectively, these partners added significant diversity, contributing both high-tech goods and essential commodities. Their combined presence underscores Panama’s multi-sourced procurement strategy.Among the fastest-growing sources of imports, Congo surged an astonishing 29,033.63%, albeit from a low base, reaching $8,524 in June. Luxembourg followed with a 2,016.73% increase, hitting $124,941. Serbia, Moldova, and Zaire all posted triple-digit percentage gains. While these countries contribute marginally in absolute terms, such spikes often signal emerging trade lanes or one-time strategic deliveries.On the product side, the top-performing categories showed impressive growth. Leading the charge was HS 100119 [wheat and meslin (excluding seed)], which surged 92.11% to $9.79 million. Key buyers included HARINAS DEL ISTMO S.A., GOLD MILLS DE PANAMA S A, and HARINERA ORO DEL NORTE.HS 230990 [non-retail dog/cat food] rose 72.13% to $10.46 million, led by EL ROBLE DEL RIO, S.A. and others.HS 854449 [low-voltage electric conductors]gained 51.91%, with major players including VIAKABLE PANAMA, S.A..HS 870333 [diesel vehicles over 2500cc]and HS 230400 [soybean oilcake and residues] grew 23.40% and 22.46%, respectively, reflecting demand in Panama’s transportation and livestock sectors.In conclusion, Panama’s import activity in June 2025 displayed mild contraction in value yet vibrant diversification across suppliers and products. The United States and China continue to dominate the landscape, while explosive growth from smaller economies signals emerging patterns worth monitoring. Agricultural goods, pet nutrition, and electric components drove product-level momentum, pointing to sustained consumption and infrastructure investment. Looking ahead, these dynamics position Panama for adaptive sourcing in a changing global trade environment....