April 2025 Argentina Import Insights
In April 2025, Argentina’s import market demonstrated a robust rebound, with total import value reaching USD 10.7277 billion in April—up 14.47% from March’s USD 9.3713 billion—across 638,774 recorded transactions. This uptick underscores a renewed vigor in domestic demand and supply chain normalization, signaling a promising start to Q2 for regional trade dynamics. Insights presented herein are powered by NBD DATA.
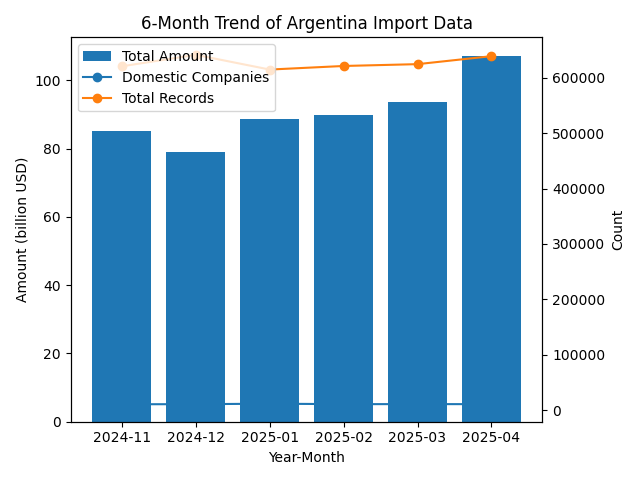
Six-Month Trend Analysis
Between November 2024 and April 2025, Argentina’s import figures exhibited a V-shaped recovery followed by a breakout. Starting at USD 8.505 billion in November 2024 and dipping to USD 7.914 billion in December, the market rebounded to USD 8.884 billion in January 2025. February saw a modest rise to USD 8.990 billion, then USD 9.371 billion in March, before surging to USD 10.728 billion in April. Concurrently, the number of active domestic importers hovered around 11,000–12,000 firms, peaking at 11,897 in January and stabilizing at 11,077 in April, while total transaction records increased from 620,507 to 638,774. This parallel growth in transaction volume and firm participation highlights strengthening market confidence and diversified sourcing. 【
Top 10 Trade Partners
Brazil leads as Argentina’s foremost source of imports, supplying USD 2.622 billion worth of goods in April across 2,696 Argentine importers and 2,064 distinct product categories—reflecting deep bilateral integration in agricultural and industrial inputs. The United States follows with USD 1.921 billion (2,348 importers, 1,904 categories), driven by high-value machinery and technological components. China ranks third at USD 1.364 billion, engaging 5,229 local importers in 2,492 categories, solidifying its role in consumer electronics and intermediate goods supply. Domestic “imports” (re-imports or intra-company transfers) accounted for USD 589 million via 472 firms and 1,138 product lines. Germany (USD 359 million, 1,059 firms, 1,512 categories) and Paraguay, Uruguay, Thailand, Vietnam, and Mexico round out the top ten, collectively contributing USD 1.910 billion and illustrating Argentina’s broadening geographic supplier base.
.png)
Fastest-Growing Trade Partners
At the country level, Liechtenstein recorded a staggering 7,446,978.38% month-on-month increase—albeit from a minimal base—achieving USD 82,662 in April, reflecting niche high-precision equipment imports. Malta followed with USD 187,267 (up 34,019.39%), driven by philatelic and security printing materials. Trinidad and Tobago’s imports jumped by 28,182.34% to USD 28.37 million, highlighting surging petrochemical feedstock needs. Lithuania’s April imports of USD 5.197 million grew 2,179.03%, propelled by specialty industrial raw materials. Oman surged to USD 117,142 (1,728.25% growth), underscoring renewed interest in refined petroleum products. These outliers, although influenced by low prior-month volumes, point to emerging specialized supply channels.
.png)
HS-Code Product Trends
Among HS-coded categories, HS 890690 with USD 140.33 million (↑215.36%), driven by offshore service vessel acquisitions by TGS AP INVESTMENTS AS SUCURSAL ARGENTINA (USD 140.28 million) and SIPETROL ARGENTINA SA-YPF SA. UTE (USD 44,440). Next, HS 490700 (unused postage stamps, banknotes, checks) surged 207.12% to USD 1.0507 billion, with Banco Central de la República Argentina importing USD 669.98 million and Banco de Galicia y Buenos Aires S.A. USD 111.89 million. HS 281820 (aluminium oxide) rose 56.60% to USD 56.14 million, led by Aluar Aluminio Argentino (USD 55.80 million). HS 271012 (light petroleum preparations) reached USD 141.18 million (↑55.43%), with Vitol Argentina S.A. and Shell Compañía Argentina de Petróleo S.A. leading. Finally, HS 300490 (therapeutic medicaments) climbed 47.08% to USD 91.84 million, driven by Novartis Argentina S.A. and Shire Human Genetic Therapies S.A..
Conclusion
April’s performance highlights Argentina’s transition to a higher plateau of import activity, underpinned by diversified sourcing and the resurgence of key sectors—from maritime services to financial instruments and pharmaceuticals. Brazil, the U.S., and China remain linchpins, while niche markets emerge from smaller partners. Product-level gains in vessels, security printing, alumina, refined oils, and therapeutics suggest ongoing shifts toward high-value, specialized imports. Looking ahead, sustained global supply chain stability and evolving domestic demand will likely propel further growth, positioning Argentina’s import sector for continued expansion. Powered by NBD DATA.


