May 2025 Peru Import Report: Performance, Leading Trade Partners, and Growth Drivers
In May 2025, Peru’s import sector recorded a total value of USD 5.049 billion, up from USD 4.655 billion in April—a month-on-month increase of 8.47%—across 1,144,900 transaction records. This sustained growth underscores the resilience of Peru’s external procurement landscape amid shifting global supply-chain dynamics.
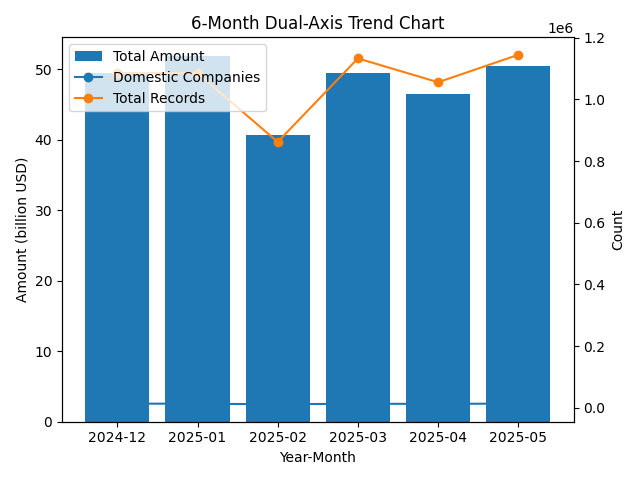
Recent Six-Month Trends Analysis
Between December 2024 and May 2025, Peru’s monthly import values exhibited notable volatility. After peaking at USD 5.195 billion in January 2025, imports dipped to USD 4.066 billion in February before rebounding to USD 4.953 billion in March. April saw a mild contraction to USD 4.655 billion, but May’s uptick to USD 5.049 billion marks a return to levels comparable with early-year highs. Concurrently, the number of active domestic importing companies fell from 13,240 in December to 11,156 in February before climbing to 13,474 in May, while total monthly records varied in parallel—from 1,086,662 in December down to 862,256 in February and back up to 1,144,900 in May—indicating renewed market engagement.
Top Ten Trade Partners Analysis
1. United States
Imports from the United States amounted to USD 1.22 billion in May, facilitated by 3,004 Peruvian buyers and 1,434 U.S. suppliers, covering 2,389 distinct product categories. This leadership position reflects strong bilateral ties in machinery, agricultural inputs, and consumer goods.
2. China
China ranked second with imports valued at USD 795 million, involving 6,784 Peruvian buyers and 2,234 Chinese suppliers across 2,643 product lines. The breadth of categories—particularly electronics and industrial components—highlights China’s role as a critical source of manufacturing inputs.
3. Singapore
Singaporean exports to Peru reached USD 271 million, with 251 Peruvian buyers engaging 67 Singaporean suppliers in 562 product segments. Singapore remains a specialized hub, especially for chemical and energy-related commodities.
4. Hong Kong (China)
Imports via Hong Kong totaled USD 270 million, supported by 864 Peruvian buyers and 291 Hong Kong suppliers across 1,332 categories, underscoring the territory’s function as an intermediary for re-exported electronics and luxury goods.
Collectively, the remaining six partners—Switzerland (USD 208 million), Spain (USD 198 million), Brazil (USD 197 million), Uruguay (USD 196 million), Chile (USD 163 million), and Germany (USD 126 million)—accounted for over USD 1.088 billion in May. Together, they engaged more than 4,121 Peruvian buyers and 1,994 partner suppliers across a combined total of 7,076 product categories, reflecting a highly diversified import base.
.png)
Fastest-Growing Five Countries
Iraq recorded a meteoric increase from USD 1.6 thousand in April to USD 240.5 thousand in May, a 14,930% surge—driven largely by new procurement of industrial minerals and construction materials for energy projects.
Morocco saw imports jump to USD 578.2 thousand from USD 4.5 thousand, a 12,685% rise, as Peruvian food processors diversified edible-oil sourcing.
Barbados exports climbed to USD 505.0 thousand from USD 26.2 thousand, up 1,824.9%, reflecting niche growth in beverages and specialty foodstuffs.
Russia grew to USD 56.6 thousand from USD 12.8 thousand, a 344.1% increase, underpinned by strategic machinery parts acquisitions.
Curaçao imports rose to USD 220.5 thousand from USD 51.5 thousand, a 328.5% spike, as logistics providers expanded marine-service procurements.
Commodity Trends and HS Code Analysis
Among the fastest-growing import categories, five HS codes stand out:
HS 870410 reported a 115.07% increase to USD 48.54 million. Key buyers include LA ARENA S.A. and FERREYROS SOCIEDAD ANÓNIMA.
HS 150710 rose 103.11% to USD 60.11 million, driven by ALICORP SAA and CARGILL AMERICAS PERU S.R.L..
HS 720449 climbed 94.17% to USD 39.87 million, with notable purchasers CORPORACION ACEROS AREQUIPA S.A. and PRODUCTOS PARA LA METALURGIA S.A.C..
HS 100199 increased 87.54% to USD 65.19 million, anchored by ALICORP SAA and COMPANIA MOLINERA DEL CENTRO S.A..
HS 870421 grew 55.40% to USD 64.18 million, led by TOYOTA DEL PERU S A and DERCO PERU S.A..
Conclusion
May 2025’s import performance underscores Peru’s strategic diversification—both by deepening ties with traditional partners (the United States and China) and by exploring emergent sources (Iraq, Morocco). Rapid growth in key commodity segments, notably industrial vehicles and edible oils, reflects robust demand in mining, construction, and food processing. Looking ahead, continued supply-chain resilience and targeted diversification will be critical for sustaining import momentum through the second half of 2025.


