Medical Instruments and Pet Foods Drive Panama’s Import Expansion in April 2025

Publishing Date:2025-05-29 22:37:26 Source: NBD Data(en.nbd.ltd)

In April 2025, Panama’s imports totaled USD 1.25 billion, marking a 7.21% increase over the previous month’s USD 1.16 billion. The uptick was supported by 148,717 import records, reflecting a healthy level of transactional activity. According to NBD DATA this momentum signals sustained demand diversification across critical sectors, particularly in healthcare, agriculture, and consumer products.

From November 2024 through April 2025, Panama’s import volumes demonstrated relative resilience and consistency. Monthly totals fluctuated within the range of USD 1.17 billion to USD 1.26 billion. The number of active Panamanian importers has remained steady—hovering around 5,200 to 5,400 firms—with April seeing 5,354 domestic entities engaging in cross-border transactions. Total record counts showed minor seasonal variations, indicating a robust data footprint.

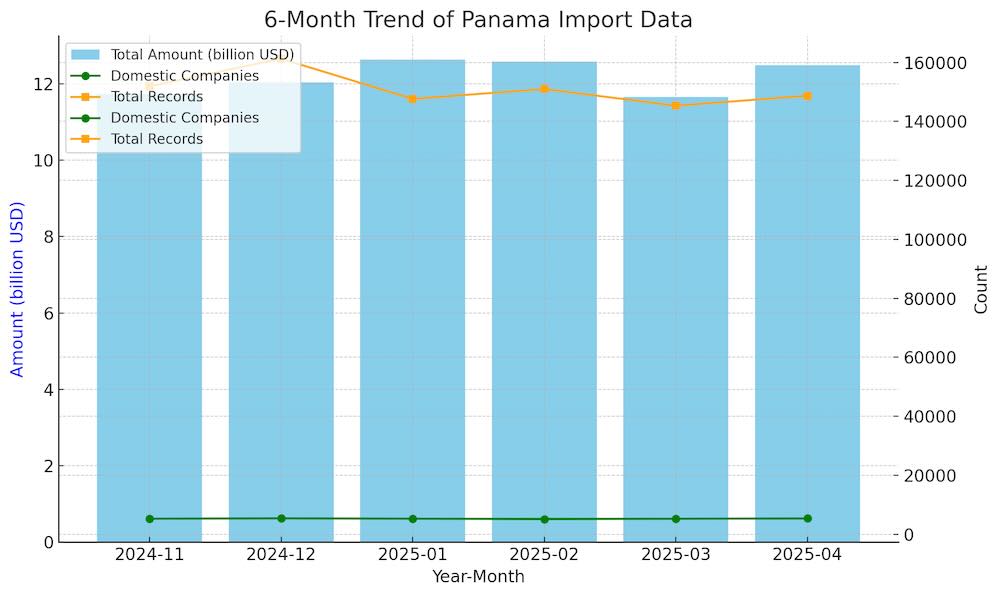
The United States remained Panama’s dominant trade partner, contributing USD 247 million in imports. With 1,911 Panamanian buyers transacting with 3,019 American suppliers, the bilateral corridor covered an impressive 2,284 product categories. This underscores Panama’s heavy reliance on U.S.-sourced industrial goods, technology, and consumer merchandise.

China followed closely with USD 161 million, spanning 1,732 local firms and 2,858 Chinese exporters, touching 1,964 categories. The China-Panama trade corridor reflects a high degree of vertical integration and cost efficiency, especially in electronics, machinery, and household goods.

Mexico ranked third with USD 55 million, involving 461 Panamanian companies and 755 Mexican suppliers. Despite the smaller network, its 765-product range points to focused imports in food and intermediate industrial goods. Costa Rica came in fourth with USD 39 million, involving 313 local firms, supplying 413 categories through 384 Costa Rican exporters—a reflection of regional supply-chain connectivity.

The remaining six of Panama’s top 10 partners—Colombia, Spain, France, Japan, and Guatemala—contributed a collective USD 150+ million. Though individually smaller, their trade portfolios enhance Panama’s market diversity and product sourcing flexibility.

While traditional partners maintained volume leadership, new entrants surged. Algeria led the growth board with a staggering 71,713.96% month-over-month increase—from just USD 137 in March to nearly USD 99,000 in April. Malta and Estonia posted similarly sharp expansions, with 42,895.72% and 31,203.56% increases, respectively.

Guyana and the Netherlands Antilles also showed exponential gains, driven by niche commodities and smaller-volume experimental shipments. These figures signal a potential broadening of Panama’s supplier base in energy, agro-commodities, or medical materials.

At the commodity level, the fastest-growing product was the HS code 851713, likely referring to mobile communications equipment, with import values rising from USD 8.68 million to USD 18.30 million (+110.88%). Key importers included COMPUTACION MONRENCA PANAMA S A, CABLE & WIRELESS PANAMA S A, and BRIGHT PANAMA CORP., signaling ongoing infrastructure upgrades in the telecom sector.

Medical instruments under HS code 901890 saw imports jump 108.58%, led by CYBER ROBOTICS PANAMA S.A. and PROMOCION MEDICA S.A. This aligns with broader regional investments in healthcare infrastructure.

Other notable gainers included 100119 (non-seed durum wheat) with USD 7.94 million, 040690 (unprocessed cheese) at USD 5.29 million, and 230990 (non-retail pet food) at USD 7.06 million. Importers such as HARINAS DEL ISTMO S.A., NESTLE PANAMA, S.A., and OPEN BLUE SEA FARMS PANAMA S A underscore Panama’s evolving food ecosystem and rising consumer sophistication.

In conclusion, Panama’s April 2025 import profile demonstrates a well-balanced combination of traditional trade strength and emerging opportunities. Medical equipment and pet food categories represent both economic and social transitions, while the surge from new trade partners suggests a strategic diversification in procurement routes. As geopolitical dynamics and supply chains evolve, NBD DATA anticipates that Panama will continue leveraging its logistical position to optimize import flows and expand bilateral trade horizons.

Related Recommendations

Offer

High-Tech Machinery and Fertilizers Boost Ethiopia’s Imports Despite Monthly Decline

2025-06-09 11:58:41

In May 2025, Ethiopia recorded total imports amounting to USD 1.53 billion, representing a 4.66% decrease from April’s USD 1.60 billion. Despite this month-over-month decline, the volume of trade activity remained resilient, as evidenced by 26,700 customs records. A total of 3,869 Ethiopian importers were active during the month, signaling consistent demand across key sectors.Over the past six months, Ethiopia’s import performance has shown a fluctuating trend. From USD 1.54 billion in December 2024, imports surged to USD 1.73 billion in January, dipped to USD 1.29 billion in February, then rebounded to USD 1.58 billion in March and USD 1.60 billion in April before tapering off in May. The number of domestic importers remained relatively stable, fluctuating modestly between 3,500 and 3,900. This pattern suggests strong underlying trade resilience despite cyclical adjustments.Among Ethiopia’s top trading partners in May 2025, China remained the largest contributor, supplying goods worth USD 358 million across a wide spectrum of 1,889 product categories. A total of 1,719 Ethiopian importers were involved in this trade, highlighting China’s continued dominance as Ethiopia’s most diversified and critical supplier.Djibouti ranked second with USD 346 million in imports and 943 Ethiopian companies engaged. As Ethiopia’s key maritime and transit gateway, Djibouti plays a vital logistical role in facilitating broad-based commodity inflows, spanning 817 product types.Kuwait followed with USD 193 million in goods imported, although the trade was highly concentrated—only 2 Ethiopian companies participated, and just 3 product categories were recorded. This suggests focused imports likely related to energy or petrochemical inputs.Saudi Arabia contributed USD 140 million in shipments involving 53 Ethiopian importers and 71 distinct product categories, underlining its role in supplying refined fuel, chemicals, and basic industrial inputs.Other key trading partners included India, the United Arab Emirates, Russia, Belgium, South Korea, and Hong Kong (China). These six economies collectively contributed approximately USD 272 million in imports. The trade involved a wide array of goods—India (603 categories), the UAE (863), Belgium (165), South Korea (147), and Hong Kong (China) (281). Notably, Hong Kong continues to serve as a high-efficiency re-export hub for electronics, components, and consumer goods. The diversity and volume across these markets reinforce Ethiopia’s growing integration into multiple global supply networks.The fastest-growing trade relationships in May were led by Romania, which surged by an astonishing 517,450.55% to USD 2.7 million, likely driven by the entry of new commodity categories. Lithuania, Qatar, and Colombia also showed explosive growth exceeding 6,000%, albeit from a low base. Sudan rounded out the top five with a 2,757.65% increase to USD 671,000, possibly indicating a recovery in regional supply chains. These countries, while representing modest absolute values, point to Ethiopia’s expanding diversification in trade channels.By commodity, the most significant growth was recorded in turbine parts for jet engines(HS Code: 841191), which rose 146.44% month-over-month to USD 18.49 million. The top importer was ETHIOPIAN AIRLINES GROUP, indicating sustained investment in aviation assets.Second came mechanical excavators and loaders(HS Code: 842959), with imports rising 115.90% to USD 23.90 million. Leading importers included MOTA-ENGIL, ENGENHARIA E CONSTRUCAO, JERR PRIVATE LIMITED CO., and ANHAMA TRADING P.L.C, reflecting construction and infrastructure momentum.Ethiopian Agricultural Businessesled the import of diammonium phosphate fertilizers(HS Code: 310530), which more than doubled to USD 87.78 million, emphasizing sustained agricultural input demand.Herbicides and plant-growth regulators(HS Code: 380893) reached USD 14.59 million (+107.18%), sourced primarily by OROMIA AGRICALTURAL COOPERAT.FEDERA, MEZGEBU DUGUMA DEBESA, and YOHAM PLC.Finally, therapeutic retail medicaments (HS Code: 300490) grew by 78.48% to USD 41.38 million. The dominant buyer was ETHIOPIAN PHARMACEUTICALS SUPPLY SE, alongside KARE PHARMACEUTICALS PLCand BEKER GENERAL BUSINESS PVT.LTD., underscoring growing healthcare sector demand.In conclusion, while Ethiopia’s import value contracted marginally in May, the strategic composition of its trade structure remains robust. Major gains in aviation, construction, agriculture, and healthcare suggest forward-looking investments. Powered by NBD DATA, such granular trade intelligence allows stakeholders to track opportunities, optimize sourcing, and anticipate market shifts in real time....

Offer

Bangladesh’s Imports Fell to $6.49B in April 2025, with China Dominating the Trade Landscape

2025-05-30 15:36:00

In April 2025, Bangladesh reported total imports of $6.49 billion, reflecting a 3.25% decline from the previous month’s $6.71 billion. Despite the contraction in total value, activity remained elevated with 394,489 customs entries recorded, underscoring continued procurement momentum across key industries. This analysis is based on transactional-level intelligence extracted by NBD DATA, a global leader in customs analytics.6-Month Dual-Axis Trend AnalysisThe past six months reveal a gradual downward trajectory in import volume following a peak of $7.16 billion in December 2024. While April’s figure marks a continued decline, Bangladesh’s import ecosystem has proven resilient. 14,706 domestic firms were active in April—broadly in line with previous months—while the total number of records increased for the second consecutive month, pointing to a possible shift toward smaller, more frequent orders and diversified sourcing.Top 10 Trade Partners: China Extends Its LeadChina remains Bangladesh’s primary import source, contributing $1.989 billion, which accounts for nearly 31% of total monthly imports. The breadth of this partnership is significant—8,352 Bangladeshi importers engaged with 29,023 Chinese exporters, spanning 3,073 distinct product categories. This robust channel underscores China’s critical role in supplying raw materials, equipment, and intermediate goods.India ranked second with $851 million, facilitated by 5,102 domestic importers and 9,119 Indian suppliers across 2,019 product lines. This long-standing corridor continues to support Bangladesh’s textile and industrial base.Indonesia and Brazil contributed $495 million and $377 million, respectively. Indonesia maintained a relatively balanced exchange between 563 Bangladeshi firms and 608 Indonesian exporters, while Brazil’s narrow product focus—just 67 categories—suggests a concentration in agro-based and primary commodities.Other notable partners include Singapore, Japan, Malaysia, Saudi Arabia, the United States, and Vietnam. Together, they accounted for nearly $13 billion in cumulative trade value, enhancing the country’s access to electronics, chemicals, and finished goods.Nontraditional Markets See Explosive Month-Over-Month GrowthApril’s data revealed surprising momentum from several nontraditional partners. Trinidad and Tobago surged by a staggering 427,946%, albeit from a negligible base, reaching $111,292. Similarly, Bosnia and Herzegovina, Moldova, Croatia, and Estonia posted growth rates ranging from 7,194% to 17,660%. While absolute values remain small, these figures indicate Bangladesh is actively expanding its supplier network to hedge supply chain risks and optimize price dynamics.Product Trends: Technical Fabrics and Electronics Take the LeadApril’s import surge was led by five high-performing HS codes, signaling robust demand in textiles and technology:HS 600192: Pile synthetic fabrics surged 184.11% to $67.16 million. Top importers included AKH STITCH ART LTD.with $2.19M and KNIT ASIA LIMITEDwith $2.07M—both major players in Bangladesh’s apparel exports.HS 600410: Wide elastic knitted fabrics rose 132.52%, totaling $88.39 million. Leading buyers were CRYSTAL MARTIN APPAREL BANGLADESHand LIZ FASHION INDUSTRY LIMITED, key suppliers for international retail brands.HS 540752: Dyed polyester woven fabric increased 71.74%, with TITAS SPORTSWEAR INDUSTRIES LTD.and YOUNGONE (CEPZ) LIMITEDas top importers.HS 590320: Polyurethane-coated textiles grew 61.39% to $44.15M. SNOWTEX OUTERWEAR LTDand BARIDHI GARMENTS LTD.were key actors in this segment, reflecting strong demand for technical outerwear materials.HS 854239: Electronic integrated circuits gained 53.36%, with monthly volumes reaching $30.04 million. Major technology importers included ISMARTU TECHNOLOGY BD LTD.and BENLI ELECTRONIC ENTERPRISE CO..ConclusionWhile Bangladesh’s total imports dipped slightly in April 2025, deeper insights from NBD DATA suggest underlying expansion in strategic sectors. Established channels with China and India remain strong, while a notable rise in technical fabrics and semiconductors marks the country’s evolving industrial priorities. Simultaneously, growth from smaller economies and rare trade partners reflects a tactical diversification of sourcing strategies.As the global supply chain landscape continues to evolve, Bangladesh appears to be positioning itself for greater flexibility and competitiveness in key manufacturing sectors....

Offer

Lesotho’s April Imports: Medical Goods and Essential Commodities Lead Amid South Africa Dominance

2025-05-30 11:07:59

In April 2025, Lesotho imported goods worth approximately $129.99 million, reflecting a 6.07% decrease from the previous month’s $138.39 million. Despite this modest contraction, import activity remained robust, with 108,194 records captured—underscoring steady engagement from domestic firms. All figures are sourced from NBD DATA, a leading global trade intelligence platform.Monthly Trends: Moderate Correction Following Seasonal HighsLesotho’s import volume has undergone a mild downward adjustment after peaking at $169 million in November 2024. April’s total is in line with Q1 trends, with 1,871 local companies participating in cross-border procurement. Transaction frequency, as indicated by the number of records, has remained consistent above the 100,000 mark for six consecutive months, reflecting a structurally active import base.Trade Partner Snapshot: South Africa Remains IndispensableAs Lesotho’s geographic and economic anchor, South Africa contributed over $106 million in imports this month—over 80% of the total. The bilateral relationship spans 2,648 product categories, serviced by 4,210 South African exporters and 1,724 Lesotho importers. This deep integration underscores South Africa’s critical role in supplying industrial inputs, fuel, and consumables to Lesotho.China ranked second, accounting for approximately $9 million in imports, across 302 product types. While smaller in value, China’s footprint extends to durable goods, medical devices, and textiles, with 96 local buyers engaging 126 Chinese suppliers.India, Taiwan (China), and Hong Kong (China) followed, each contributing around $2–3 million. Japan and Lithuania also maintained modest volumes, mainly in machinery, chemicals, and niche categories. Meanwhile, countries like Sweden and Brazil contributed small but diversified shipments.Fastest-Growing Origins: Europe and U.S. Show MomentumApril witnessed substantial growth in imports from Sweden (+458.71%), Spain (+329.42%), and the United States (+327.21%)—albeit from a low base. This trend signals new or reactivated procurement channels in specialized goods, potentially linked to public health or industrial inputs. Nigeria also saw a 200%+ surge, suggesting expanding African regional ties.Product-Level Growth: Healthcare, Energy, and Food Take Center StageAt the product category level, health-related goods led the pack. The top-performing HS code—300490, representing other therapeutic medicaments for retail sale—soared to $3.66 million, up 166.18% month-over-month. Key domestic buyers include:NATIONAL DRUG SERVICE ORGANISATION– $2.94 millionMOF- PROJECT MANAGEMENT UNIT– $164KINTEGRATED HEALTHCARE SOLUTIONS (PTY) LTD.– $127KAlso notable is HS code 382219, a broad chemical classification that increased 81.75% to $1.58 million, largely procured by Ministry of Health Project Accounting Unit and Elizabeth Glaser Pediatric AIDS Foundation.Among commodities, cotton (520100)grew 65.41%, driven by FORMOSA TEXTILE COMPANY (PTY) LTD, while liquefied natural gas (271111)and maize (100590)recorded strong, stable growth of 29.52% and 27.42% respectively. These reflect steady demand for energy and staple foods, procured by entities like SECHABA MILLING COMPANYand AFROX LESOTHO.Conclusion: Trade Realignment With Core and Emerging ChannelsLesotho’s April import data reveals a nuanced shift: while traditional partners like South Africa continue to dominate, emerging growth from Europe and the U.S. signals diversification. Core sectors—healthcare, chemicals, energy, and agriculture—remain at the forefront, offering stability amid cyclical adjustments. Importers and policymakers can leverage insights from NBD DATA to refine sourcing strategies and ensure resilient supply chain planning....