Nigeria’s Imports in April: Signs of Realignment Behind the Slowdown
In April 2025, Nigeria’s total import value dropped to USD 7.13 billion, down 13.14% from March’s USD 8.2 billion. This marked a visible cooling in headline trade figures. However, the broader activity landscape tells a more nuanced story. Despite the decline, over 113,700 transactions were recorded, involving 12,925 Nigerian importers. According to NBD DATA, these numbers point not to a collapse, but rather to a structural recalibration of demand and sourcing patterns.
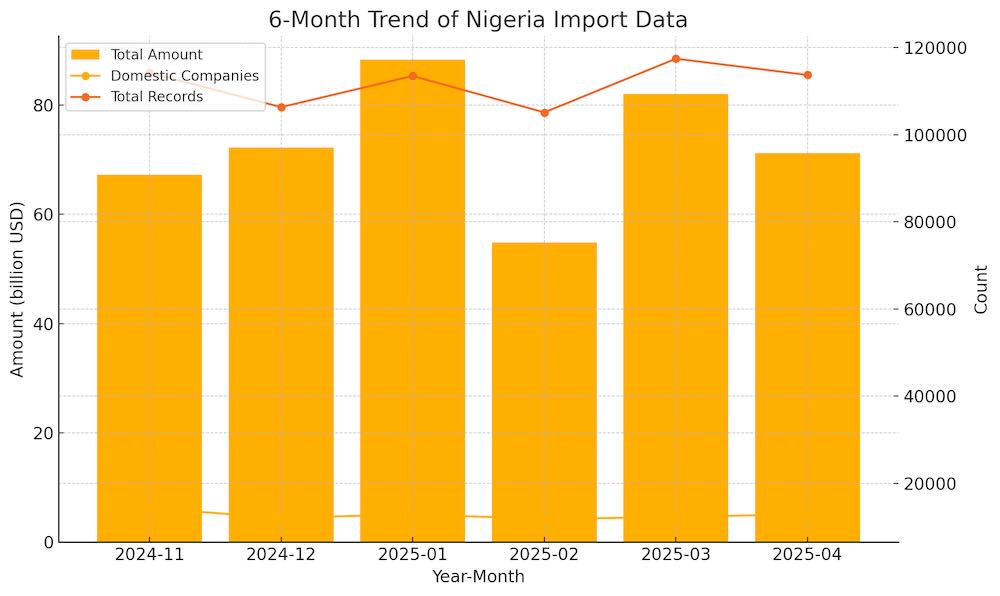
Tracking Six Months of Trade Flux
Nigeria’s imports have fluctuated significantly over the past six months. After peaking at USD 8.83 billion in January, total imports fell sharply in February before rebounding in March and dipping again in April. Interestingly, the number of active importers has stayed relatively steady throughout the period, hovering between 11,800 and 14,300, indicating that businesses are adjusting purchasing strategies rather than exiting trade altogether.
Top Partners: Familiar Names, Shifting Roles
China remains Nigeria’s dominant trade partner, exporting USD 880 million worth of goods to the country in April. A dense network of 3,590 Nigerian buyers and 6,004 Chinese suppliers transacted across 2,033 product categories, reaffirming China’s role in Nigeria’s industrial and consumer supply chains.
India followed with USD 282 million in exports, spanning 1,140 product types and connecting 1,197 Nigerian firms with 1,787 Indian suppliers. The United States, ranked third with USD 190 million, had a broader importer base—3,862 Nigerian firms—suggesting wide horizontal demand.
While Togo’s USD 176 million in trade may appear surprising, the deal structure was highly concentrated: just 20 Nigerian companies trading with 14 Togolese exporters over 8 product lines. This indicates targeted demand—likely related to regional re-export strategies.
Meanwhile, countries like the UAE, Netherlands, Belgium, and Equatorial Guinea formed a diverse secondary tier of trade partners. Combined, these markets contributed over USD 600 million in import value across thousands of product categories, underscoring Nigeria’s multi-vector sourcing strategy.
.jpg)
Fastest Growing Sources: The Newcomers to Watch
Nigeria’s April data also highlighted astonishing growth from several lesser-known partners. Equatorial Guinea topped the list with a staggering +198,676% month-over-month surge, reaching USD 90.7 million. This likely reflects bulk deliveries tied to large-scale industrial or energy-linked contracts.
Bolivia and Antigua and Barbuda saw similarly explosive jumps, albeit from much smaller bases, suggesting the emergence of niche trade channels. Even Kazakhstan entered the radar with a notable uptick from zero the month prior. Senegal’s 3,490% rise adds to the chorus of shifting regional dynamics.
.jpg)
Leading Products: Strong Demand Amid Volatility
The product categories driving growth tell a forward-looking story. Imports of frozen blue whiting fish (HS Code 030368) more than doubled, reaching USD 26.5 million. Key buyers included OCEAN LORD LTD., CIC LTD., and SOLEM AGRO VENTURES LTD.—all indicators of expanding cold-chain distribution networks.
Wheat and durum wheat imports (HS Code 100119) soared by 93%, totaling over USD 206 million. Major importers such as CROWN FLOUR MILLS LIMITED and FLOUR MILLS OF NIGERIA FZEpoint to a sustained appetite in Nigeria’s food manufacturing sector.
Meanwhile, industrial valve systems (HS Code 848180) jumped nearly 85%, serving infrastructure customers like DANGOTE PETROLEUM REFINERY. Cashew nuts in shell (HS Code 080131) also gained traction, with STARLINK GLOBAL & IDEAL LTD. among the top importers—an indicator of growing domestic processing capabilities.
Outlook: Realignment Over Retraction
Despite the headline contraction, NBD DATA sees Nigeria’s April trade activity as a reflection of strategic realignment—not withdrawal. Importers are recalibrating sources, shifting product priorities, and expanding new trade routes. As supply chains mature and regional partnerships evolve, we expect this realignment to deepen, paving the way for more resilient and diversified trade structures in the quarters ahead.


