Uruguay’s April 2025 Imports: Modest Growth Driven by Aquatic By-Products and Automotive Goods
In April 2025, Uruguay recorded an import volume of USD 1.917 billion, reflecting a modest month-on-month increase of 0.89% from USD 1.900 billion in March. This growth was accompanied by 143,983 recorded transactions, underscoring stable commercial activity within the country's international procurement landscape. These insights, provided by NBD DATA, offer a granular view of Uruguay’s evolving trade structure and sectoral dependencies.
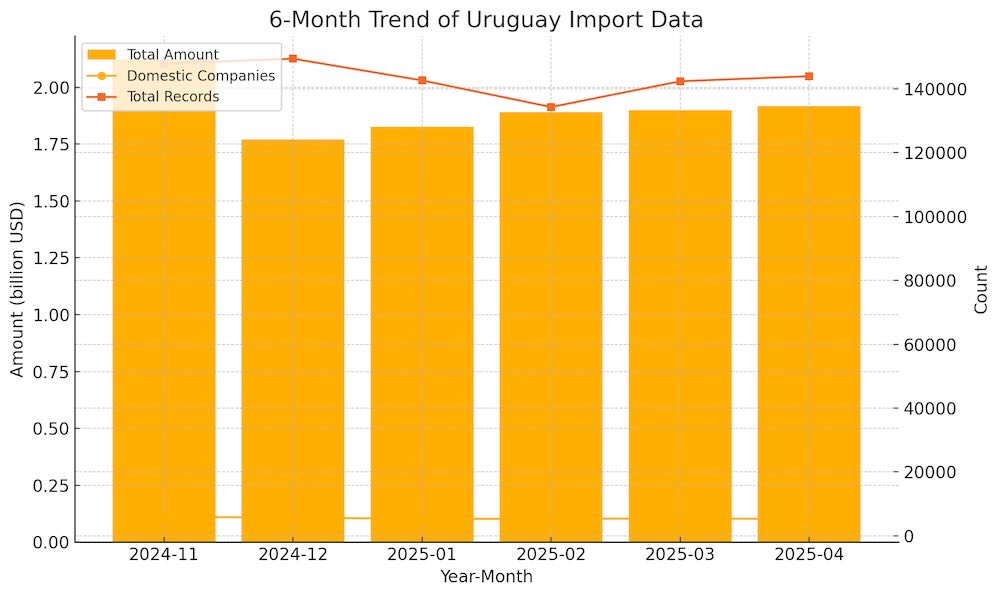
Over the past six months, Uruguay’s monthly import values have shown a moderately fluctuating yet overall ascending trend. Starting from a high of USD 2.121 billion in November 2024, imports dipped to USD 1.770 billion in December before gradually recovering to USD 1.917 billion in April 2025. Notably, the number of active importing companies peaked in March at 5,391 and slightly declined to 5,223 in April. Meanwhile, transaction counts remained consistently above 140,000 per month, suggesting operational continuity despite fluctuations in value.
Brazil, China, and Argentina remained Uruguay’s top three trade partners in April, collectively accounting for more than half of the total import value. Imports from Brazil reached USD 392 million, involving 1,419 Uruguayan buyers and a diverse portfolio of 1,750 product categories. China, with USD 195 million in imports, engaged 1,729 domestic firms and led in diversity with 1,758 product types. Argentina followed closely at USD 156 million, supported by 974 local importers.
.jpg)
Analyzing commodity-specific performance, the standout was HS code 230120, covering flours, meals, and pellets of aquatic invertebrates. Imports under this category rose by 403.68%, totaling USD 43.44 million. The leading buyers were AKER BIOMARINE ANTARCTIC S.A. and AGROWL SAS, indicative of Uruguay’s growing dependence on marine-based inputs, possibly for livestock or aquaculture feed.
In the transport sector, HS code 870121and 870421—representing small vehicles under 5 tons—grew by 73.18% and 72.58% respectively. Major importers include GUBALEN S.A., DARLAX COMPANY S.A., and AYAX S A, reflecting strong demand in commercial and government fleet renewal. Additionally, HS code 380893, comprising herbicides and plant growth regulators, saw a 56.75% increase, with buyers like RUTILAN S.A. and TAMPA S.A. contributing significantly.
In summary, while Uruguay’s total import value in April 2025 grew only marginally, the underlying dynamics point to an increasingly sophisticated import structure. The prominence of aquatic by-products and transport equipment, alongside a surge in sourcing from non-traditional regions, reflects a country adapting to both domestic demand and external market opportunities. With access to platforms like NBD DATA, policymakers and trade analysts can continue to track these micro-level patterns to inform macroeconomic and supply chain decisions.


