India’s March Imports Hold Steady Amid Surge in Precious Metals and Electronics
India’s import performance in March 2025 remained largely stable, recording a total import value of USD 60.87 billion, down marginally by 0.26% from the previous month. Despite the slight dip from February’s USD 61.03 billion, activity levels rebounded, with 4,890,756 trade records logged during the month, reflecting a continued resilience in external demand and transactional volume.
Over the past six months, India’s import trajectory has oscillated within a relatively narrow band, with values ranging from USD 57.44 billion in December to peaks above USD 61 billion in February. March figures placed India’s import value close to the top end of this range. Notably, the number of active domestic importers rose to 58,969, recovering from February’s dip, while transaction volume also rebounded, highlighting renewed trade momentum.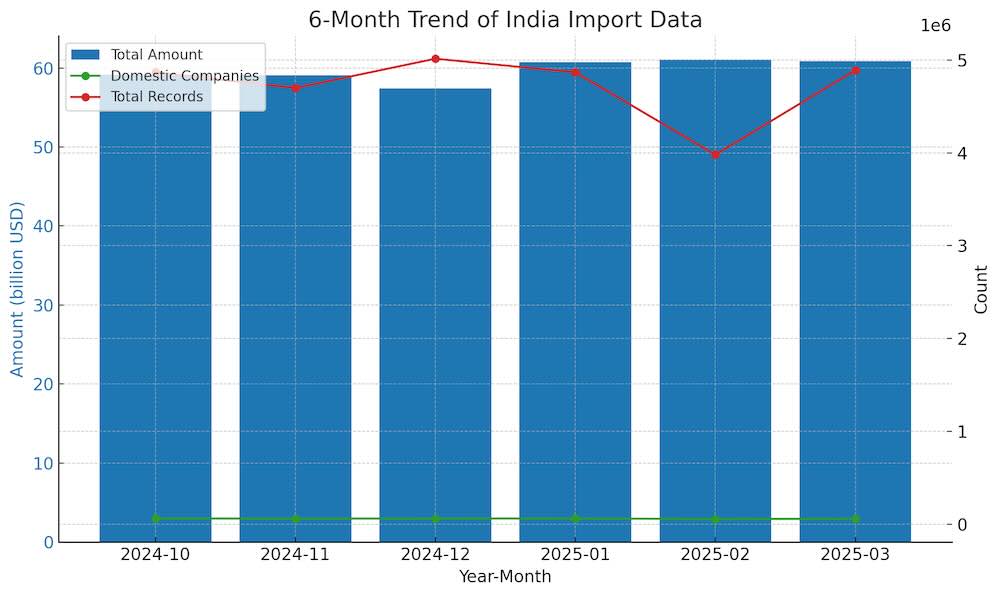
Among India’s top ten import partners, China remained the dominant source by a wide margin, contributing USD 12.33 billion in goods. The trade involved 32,271 Indian companies and 52,022 Chinese suppliers, across a staggering 3,458 product categories, reinforcing China’s role as India’s most integrated and diverse supply chain partner.
Russia followed with USD 4.93 billion in imports, concentrated across just 447 categories but involving fewer firms—524 Indian and 419 Russian companies—suggesting a focus on bulk commodities or large-scale energy and materials trade.
The United Arab Emirates and the United States ranked third and fourth, with import values of USD 4.45 billion and USD 3.80 billion, respectively. The U.S. trade relationship stood out with 8,333 Indian importers and 12,551 American exporters, spread across 2,604 categories, underscoring its strength in high-tech and diversified manufacturing.
Other notable contributors included Saudi Arabia, Iraq, Japan, South Korea, Indonesia, and Taiwan (China)—each adding strategic depth to India’s sourcing portfolio. Collectively, these six nations accounted for over USD 12 billion in imports, ranging from petrochemicals to electronics, and demonstrated India’s expanding trade mosaic..jpg)
A standout trend in March was the explosive import growth from emerging and smaller economies. Cape Verde posted an astronomical 21,319,294% increase—albeit from a negligible base—reaching nearly USD 0.89 million in trade. Similarly, Niue, Jamaica, and Guinea each saw multi-thousand percent surges, with Nigeria making a significant leap to USD 752.86 million, up more than 15,668%, likely tied to energy-related imports. These sharp increases reflect India’s growing interest in diversifying trade geographies, especially for resource-driven categories..jpg)
From a commodity perspective, high-value goods dominated the fastest-growing segments. Non-industrial diamonds not mounted or set HS 710239) rose 121.25% to USD 650.63 million, with key buyers including SHREE RAMKRISHNA EXPORTS PVT.LTD., GIA INDIA LABORATORY PRIVATE LIMITED, and HARI KRISHNA EXPORTS PRIVATE LIMITED.
Rough diamonds (HS 710231) saw a similar surge of 103.27%, with buyers like LAXMI DIAMOND PRIVATE LIMITED, MAHENDRA BROTHERS EXPORTS PVT. LTD., and R D IMPEX leading the charge.
Gold bullion (HS 710812) imports nearly doubled to USD 2.72 billion, driven by demand from MMTC - PAMP INDIA PRIVATE LIMITED, HDFC BANK LIMITED, and YES BANK LTD..
India’s appetite for portable digital data processing machines (HS 847130)—laptops and related devices—rose 89.31% to over USD 602 million, led by APPLE INDIA PRIVATE LIMITED, DELL INTERNATIONAL SERVICES INDIA PRIVATE LIMITED, and LENOVO INDIA PRIVATE LIMITED.
In the fertilizer segment, urea-based nitrogenous fertilizers (HS 310210) climbed 66.45% to USD 218.22 million, reflecting seasonal agricultural cycles. Leading importers included COROMANDEL INTERNATIONAL LIMITED., INDIAN FARMERS FERTILISER COOPERATIVE LTD., and INDIAN POTASH LIMITED.
In summary, India’s March 2025 import landscape remained steady in overall value, but dynamic in composition. Established partners like China and the U.S. continue to provide a stable supply base, while lesser-known countries show surprising growth, particularly in commodity-driven trade. The dominance of precious metals and electronics among top-growing goods points to ongoing trends in consumer demand, wealth preservation, and tech-driven growth. All data cited is sourced from NBD DATA.


