Lesotho’s April Imports: Medical Goods and Essential Commodities Lead Amid South Africa Dominance
In April 2025, Lesotho imported goods worth approximately $129.99 million, reflecting a 6.07% decrease from the previous month’s $138.39 million. Despite this modest contraction, import activity remained robust, with 108,194 records captured—underscoring steady engagement from domestic firms. All figures are sourced from NBD DATA, a leading global trade intelligence platform.
Monthly Trends: Moderate Correction Following Seasonal Highs
Lesotho’s import volume has undergone a mild downward adjustment after peaking at $169 million in November 2024. April’s total is in line with Q1 trends, with 1,871 local companies participating in cross-border procurement. Transaction frequency, as indicated by the number of records, has remained consistent above the 100,000 mark for six consecutive months, reflecting a structurally active import base.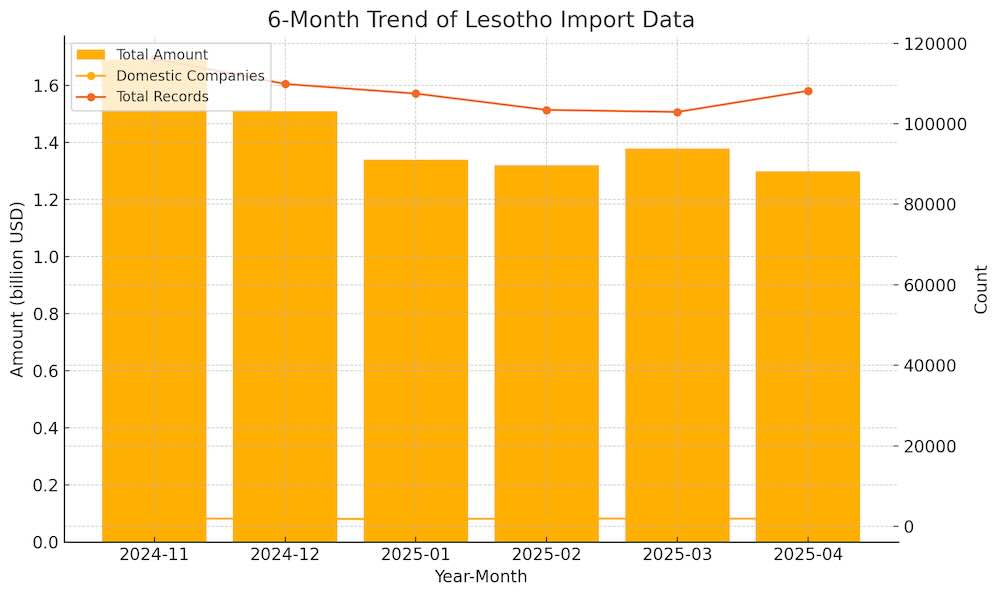
Trade Partner Snapshot: South Africa Remains Indispensable
As Lesotho’s geographic and economic anchor, South Africa contributed over $106 million in imports this month—over 80% of the total. The bilateral relationship spans 2,648 product categories, serviced by 4,210 South African exporters and 1,724 Lesotho importers. This deep integration underscores South Africa’s critical role in supplying industrial inputs, fuel, and consumables to Lesotho.
China ranked second, accounting for approximately $9 million in imports, across 302 product types. While smaller in value, China’s footprint extends to durable goods, medical devices, and textiles, with 96 local buyers engaging 126 Chinese suppliers.
India, Taiwan (China), and Hong Kong (China) followed, each contributing around $2–3 million. Japan and Lithuania also maintained modest volumes, mainly in machinery, chemicals, and niche categories. Meanwhile, countries like Sweden and Brazil contributed small but diversified shipments..jpg)
Fastest-Growing Origins: Europe and U.S. Show Momentum
April witnessed substantial growth in imports from Sweden (+458.71%), Spain (+329.42%), and the United States (+327.21%)—albeit from a low base. This trend signals new or reactivated procurement channels in specialized goods, potentially linked to public health or industrial inputs. Nigeria also saw a 200%+ surge, suggesting expanding African regional ties..jpg)
Product-Level Growth: Healthcare, Energy, and Food Take Center Stage
At the product category level, health-related goods led the pack. The top-performing HS code—300490, representing other therapeutic medicaments for retail sale—soared to $3.66 million, up 166.18% month-over-month. Key domestic buyers include:
NATIONAL DRUG SERVICE ORGANISATION – $2.94 million
MOF- PROJECT MANAGEMENT UNIT – $164K
Also notable is HS code 382219, a broad chemical classification that increased 81.75% to $1.58 million, largely procured by Ministry of Health Project Accounting Unit and Elizabeth Glaser Pediatric AIDS Foundation.
Among commodities, cotton (520100) grew 65.41%, driven by FORMOSA TEXTILE COMPANY (PTY) LTD, while liquefied natural gas (271111) and maize (100590) recorded strong, stable growth of 29.52% and 27.42% respectively. These reflect steady demand for energy and staple foods, procured by entities like SECHABA MILLING COMPANY and AFROX LESOTHO.
Conclusion: Trade Realignment With Core and Emerging Channels
Lesotho’s April import data reveals a nuanced shift: while traditional partners like South Africa continue to dominate, emerging growth from Europe and the U.S. signals diversification. Core sectors—healthcare, chemicals, energy, and agriculture—remain at the forefront, offering stability amid cyclical adjustments. Importers and policymakers can leverage insights from NBD DATA to refine sourcing strategies and ensure resilient supply chain planning.


