India's September 2024 Import Data: Key Insights, Top Trade Partners, and Shifts in Global Supply Chains
Introduction
India's global trade dynamics play a crucial role in its economic landscape, with import data offering valuable insights into consumption patterns, demand shifts, and international trade alliances. This report focuses on India's September 2024 import data, analyzing trends, shifts, and top trade partners to provide businesses and stakeholders with actionable intelligence on India's import market. Through examining the latest customs data, this report sheds light on the primary products driving India’s imports, key suppliers, and emerging trade patterns. This comprehensive analysis is essential for companies aiming to expand their reach within the Indian market.
India’s September 2024 Import Overview
In September 2024, India recorded a total of 4,838,320 import entries, reflecting a 3.6% decrease from August's 5,019,114 entries, yet a substantial year-over-year increase of 10.6%, underscoring significant long-term growth in demand. Total import expenditure amounted to $57.48 billion, marking an 18.3% monthly decline from August’s $68.04 billion but a notable 4.9% rise compared to $54.79 billion in September 2023.
- Procurement Trends: Active buyer entities in India grew to 60,076, representing a 1.4% increase from last month and a marginal year-over-year increase of 52 buyers. This stable buyer growth indicates continued demand across various sectors.
- Supply Chain Dynamics: The number of supplier entities recorded for September reached 112,394, with a minor month-over-month increase of 0.5% and a 1.1% year-over-year rise, reflecting a steady supply network actively participating in India’s import market.
This overview highlights both short-term fluctuations and long-term growth in India’s import activities, aligning with global trends that emphasize India's expanding role in international trade.
Top 5 Import Products in India – September 2024
In September 2024, India’s top imported products span a diverse range of sectors, reflecting the country’s varied demand across industries. Below is an analysis of the top five import categories, represented by their Harmonized System (HS) codes, along with changes in monthly and yearly import values.
HS Code 270900 – Crude Petroleum Oils
With a total import value of $9.85 billion this month, crude petroleum (HS 270900) remains India’s leading import category. Despite a 9.1% decline from August, demand remains high, showing only a modest year-over-year decline of 1.2%. This consistent demand reflects India’s growing energy needs.HS Code 710812 – Gold (Non-monetary)
Gold (HS 710812) imports recorded $4.51 billion in September. While gold imports dropped by a significant 49.5% month-over-month, there was a 83% increase compared to September last year, indicating a heightened interest likely driven by festive season preparations and rising investment appeal.HS Code 270119 – Coal, Other than Anthracite or Bituminous
Imports of non-anthracite coal (HS 270119) reached $2.04 billion. Although imports fell by 16% from the previous month, year-over-year values remain steady, indicating continued reliance on coal for industrial use despite seasonal fluctuations.HS Code 851779 – Communication Equipment
Communication equipment (HS 851779) surged to $1.60 billion in September, marking a 9.9% increase from August and an impressive 34.5% increase year-over-year. This category's growth underlines India’s expanding digital and telecommunication needs.HS Code 854231 – Semiconductors
Semiconductor imports (HS 854231) stood at $1.45 billion, a minor 7.6% month-over-month decrease, yet a strong year-over-year growth of 20.4%, reflecting India’s increasing investments in technology and electronics manufacturing.
The data from these top categories reveal India's priority for energy, investment commodities, and high-tech products, emphasizing its evolving import needs.
Recommended Buyers for Major Products in India
Several Indian buyers actively engage in procuring these top imports, particularly in the energy, precious metals, and electronics sectors. Below are some prominent importers and their associated details.
HS Code 270900 – Crude Petroleum Oils
- Hindustan Petroleum Corporation Limited - $1.95 billion (M-o-M: -$667 million, Y-o-Y: -$534 million)
- Bharat Petroleum Corporation Limited - $1.79 billion (M-o-M: -$734 million, Y-o-Y: -$287 million)
- Indian Oil Corporation Limited - $1.69 billion (M-o-M: -$1.43 billion, Y-o-Y: -$1.32 billion)
HS Code 710812 – Gold (Non-monetary)
- MMTC - PAMP India Private Limited - $2.18 billion (M-o-M: +$77 million, Y-o-Y: +$1.44 billion)
- HDFC Bank Limited - $316 million (M-o-M: -$1.49 billion, Y-o-Y: +$107 million)
- Aries Refinery Pvt. Ltd. - $224 million (M-o-M: -$61 million)
HS Code 851779 – Communication Equipment
- Foxconn Hon Hai Technology India Mega Development - $767 million (M-o-M: +$225 million, Y-o-Y: +$135 million)
- Tata Electronics Systems Solutions Pvt. Ltd. - $262 million (M-o-M: -$118 million)
- Pegatron Technology India Private Limited - $189 million (M-o-M: +$86 million, Y-o-Y: +$89 million)
These companies serve as pivotal players in India's import landscape, establishing significant connections within international trade and influencing demand in crucial product categories.
Analysis of Imports from China
India’s import relationship with China remains significant, particularly for electronics, machinery, and advanced technology products. In September 2024, the leading imports from China included:
- HS Code 851779 – Communication Equipment: Total imports from China were $1.45 billion, up by 12.6% from August and 35% year-over-year, driven by India’s demand for telecom equipment.
- HS Code 847130 – Portable Digital Computers: With imports valued at $616 million, this category saw a 12.1% monthly decline and a 21.5% year-over-year decrease, reflecting fluctuating demand.
- HS Code 854231 – Semiconductors: Imports were recorded at $520 million, with a minor decrease from August yet stable year-over-year figures, highlighting India’s steady demand in the tech manufacturing sector.
- HS Code 854232 – Electronic Integrated Circuits: Imports amounted to $296 million, showing slight growth over the past year due to India’s ongoing focus on electronics.
- HS Code 854239 – Electronic Components: Totaling $247 million, this category had minor month-to-month fluctuation and a yearly decrease, suggesting shifts within the supply chain.
This import pattern emphasizes India's dependency on China for technological and electronic components crucial to the country's industrial growth.
India’s Top Trade Partners
India’s trade network spans various regions, with China, the United States, and the United Arab Emirates (UAE) being key partners. Below is an overview of India’s top 10 trade partners and their respective trade values for September 2024.
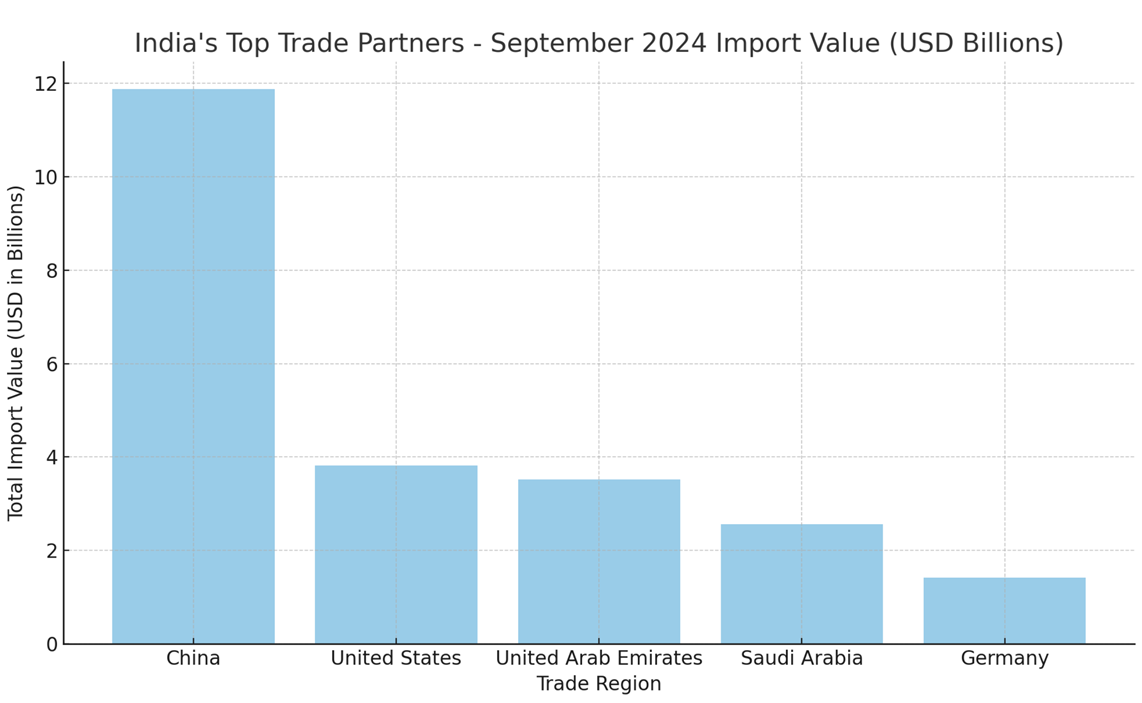
This analysis reveals the consistent role of China as India’s top trade partner, complemented by strong trade relations with the U.S. and Middle East nations.
Exchange Rate Trends
The Indian Rupee (INR) has experienced fluctuations against the U.S. Dollar (USD) over the past 12 months, with recent trends suggesting potential future adjustments. Below is the latest exchange rate analysis for the period from October 2023 to September 2024.
The exchange rate has shown an average value of 83.51 INR per USD in recent months. Future projections indicate possible stability or slight adjustments depending on international economic conditions, monetary policy, and trade volumes.
Conclusion
India’s September 2024 import data reflects a complex landscape shaped by diverse sector demands and dynamic trade relationships. The country’s reliance on energy imports, such as crude oil and coal, alongside a growing need for high-tech components like semiconductors and communication equipment, underscores its position as a major player in global trade. Partnerships with countries like China, the United States, and the UAE continue to anchor India’s import ecosystem, while shifts in the Indian Rupee exchange rate highlight economic fluctuations that may influence future import strategies.
For businesses looking to navigate or expand within the Indian market, these insights provide a roadmap to understanding India’s import trends and opportunities. NBD Data remains committed to delivering comprehensive, data-driven analyses to equip companies and stakeholders with the intelligence needed to thrive in an evolving global market.


