Ghana’s Imports in March 2025: Modest Decline Amid Strong Growth in Key Product Categories
In March 2025, Ghana recorded a total import value of $1.53 billion, marking a 3.47% decline compared to February’s $1.58 billion. Despite the marginal drop, the country logged over 206,630 import records, underlining continued vibrancy in foreign procurement activities. NBD DATA remains committed to delivering authoritative trade insights across sectors and countries.
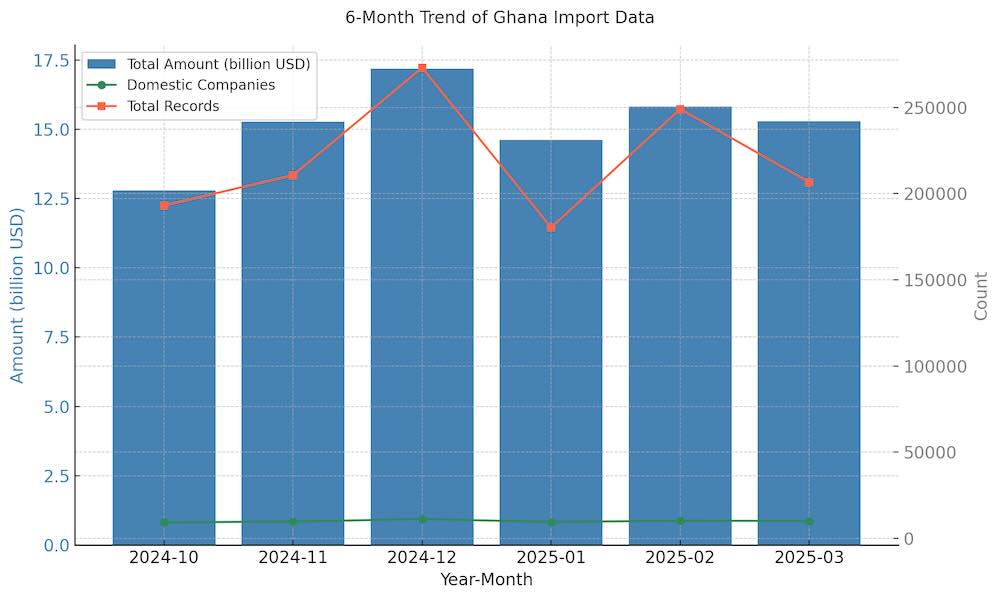
Over the past six months, Ghana’s import performance has shown cyclical variation. From October 2024’s $1.28 billion to a peak of $1.72 billion in December 2024, followed by a contraction to $1.46 billion in January 2025, trade volumes stabilized in February before a minor retreat in March. The number of domestic companies involved also mirrored this pattern, suggesting a direct relationship between corporate engagement and overall trade volume.
China Leads Ghana’s Trade, Followed by India and UAE
China retained its dominant role as Ghana’s top import source with $246 million in trade volume, involving 3,689 Ghanaian importers and 3,494 Chinese suppliers, spanning 2,348 product categories. This reflects broad-based commercial integration across industrial, consumer, and agricultural sectors.
India followed with $116 million, supported by 674 domestic buyers and 823 Indian exporters, largely focused on chemicals, pharmaceuticals, and agri-related products. The United Arab Emirates ranked third at $111 million, with a notable product diversity of 983 categories, underlining its role in supplying electronics, vehicles, and metal goods.
The Netherlands took fourth place at $68 million, supporting trade in machinery, fertilizers, and refined foods. Other key partners included Belgium, the United States, the United Kingdom, and Spain—all demonstrating consistent export footprints into Ghana. Notably, Liberia recorded $32 million in trade, but from just one buyer and one supplier, indicating a concentrated commodity channel.
.jpg)
Fastest-Growing Trade Partners: Uruguay and Liberia Surge
Uruguay led in month-over-month growth, surging by an astonishing 70,578.63% to reach $136,473, albeit from a small base. Moldova followed with $53,727, increasing 4,332.56%, highlighting new trade linkages or first-time imports.
Liberia, with a substantial rise of 4,108.23%, reached over $32 million, pointing to a single but impactful trade flow. Cambodia and Rwanda also saw significant growth at 1,894.69% and 1,564.68% respectively, driven by niche sectors.
.jpg)
Product Category Trends: Cocoa Beans, Grains, and Insecticides Drive Imports
The fastest-growing product was Cocoa beans(HS code 180100), whose import value jumped 893.48% to $87 million. Leading buyers included CHOCOMAC GHANA LIMITED., a major processor in Ghana's cocoa value chain.
Worked cereal grains (HS code 110429) followed with a growth rate of 187.15%, totaling $11.79 million. Key buyers included:
IRANI BROTHERS AND OTHERS LTD. – $9.34 million
FLOUR MILLS OF GHANA LTD. – $2.44 million
JINAM FLOUR MILLENTERPRISE – $19,818
Significant attention was also drawn to Insecticides (HS code 380891), which grew by 126.63%, reaching over $9.18 million. Major importers were:
CHEMICO LIMITED – $3.99 million
ADAMA WEST AFRICA LTD. – $1.46 million
UNITED STATES AGENCY FOR INTERNATIONAL DEVELOPMENT – $803,559
In the electronics segment, Communication equipment (HS code 851762) saw a 108.01% rise to $7.85 million, with purchases by:
SCANCOM PLC – $6.35 million
NEWMONT GHANA GOLD LIMITED – $343,759
SPACE X STARLINK GH LTD. – $342,623
For transport, Public transport vehicles (HS code 870210) climbed 57.80% to $10.67 million, led by:
WEND NA SONGDO INDUSTRIE – $4.26 million
SCANIA WEST AFRICA LIMITED – $2.88 million
SOCIETE DE TRANSPORT AOREMA ET FRERES – $437,245
Conclusion
Despite a slight dip in overall monthly import value, Ghana’s March 2025 trade data reflects robust demand in key commodities such as cocoa, grains, insecticides, and communications infrastructure. China continues to dominate as the leading partner, while Uruguay, Liberia, and Moldova indicate emerging diversification in sourcing strategies. NBD DATA will continue to monitor these developments to empower global trade decisions with real-time intelligence.


